Eavesdropping at the Speed of Light: Distributed Acoustic Sensing of Baleen Whales in the Arctic
 Léa Bouffaut1,2,3*
  Kittinat Taweesintananon1,2,4
  Hannah J. Kriesell1,2
  Robin A. Rørstadbotnen1,2
  John R. Potter1,2
  Martin Landrø1,2
  Ståle E. Johansen2,5
  Jan K. Brenne2,6 Aksel Haukanes6
  Olaf Schjelderup7
  Frode Storvik7
- 1Acoustics Group, Department of Electronic Systems, Norwegian University of Science and Technology (NTNU), Trondheim, Norway
- 2Centre for Geophysical Forecasting, Norwegian University of Science and Technology (NTNU) Gløshaugen, Trondheim, Norway
- 3K. Lisa Yang Center for Conservation Bioacoustics, Cornell Lab of Ornithology, Cornell University, Ithaca, NY, United States
- 4PTT Exploration and Production Public Company Limited, Bangkok, Thailand
- 5Department of Geoscience and Petroleum, Norwegian University of Science and Technology (NTNU), Trondheim, Norway
- 6Alcatel Submarine Networks Norway AS, Tiller, Norway
- 7Uninett AS (merged into Sikt, Jan. 2022), Trondheim, Norway
In a post-industrial whaling world, flagship and charismatic baleen whale species are indicators of the health of our oceans. However, traditional monitoring methods provide spatially and temporally undersampled data to evaluate and mitigate the impacts of increasing climatic and anthropogenic pressures for conservation. Here we present the first case of wildlife monitoring using distributed acoustic sensing (DAS). By repurposing the globally-available infrastructure of sub-sea telecommunication fiber optic (FO) cables, DAS can (1) record vocalizing baleen whales along a 120 km FO cable with a sensing point every 4 m, from a protected fjord area out to the open ocean; (2) estimate the 3D position of a vocalizing whale for animal density estimation; and (3) exploit whale non-stereotyped vocalizations to provide fully-passive conventional seismic records for subsurface exploration. This first example’s success in the Arctic suggests DAS’s potential for real-time and low-cost monitoring of whales worldwide with unprecedented coverage and spatial resolution.
1 Introduction
While slowly recovering from industrial whaling, many baleen whale species [Mysticeti; Bannister (2018)] are still threatened or critically endangered IUCN, 2021 (Version 2021-2). Simultaneously, these animals and their vast ocean habitat are subject to an increasing number of stressors driven directly or indirectly by anthropogenic activities, e.g., entanglement in fishing gear, ship strikes and noise pollution associated with the global increase in ship traffic. Additionally, alteration of water and nutrient cycles by plastic and chemical pollution affects the entire food web (Thomas et al., 2016). Climate change has further forced cetaceans to adapt their migration routes (or their timing). Globally, many species shift poleward to their preferred sea-surface temperature (van Weelden et al., 2021).
In the Arctic, the climate is changing faster than anywhere else in the world. It has been linked to major shifts in species distributions related to sea-ice loss and the Atlantification of the region (Hamilton et al., 2021). In the high latitudes of the Svalbard archipelago, boreal species, e.g., blue whales (balaenoptera musculus), fin whales (balaenoptera physalus), humpback (megaptera novaeangliae) and sei whales (balaenoptera borealis), have been considered seasonal residents, traditionally present from late spring/early summer to the fall and spending their winters at lower latitudes (Moore et al., 2019). Recently, however, fin whales have been observed year-round (Klinck et al., 2012; Lydersen et al., 2020). Furthermore, with sea-ice loss came an increase in human activities. While ship traffic is already abundant between the Barents and North sea and Svalbard (Reeves et al., 2014; Eguíluz et al., 2016), it will likely intensify in species-rich areas (Hamilton et al., 2021) with the impending cross-Arctic shipping routes (Ng et al., 2018). Airgun signals can already be recorded all year round in the western Fram Strait (Ahonen et al., 2017). Therefore, it is urgent to establish a baseline of the environment’s exposure and marine mammal vulnerability to these anthropogenic stressors to mitigate their impacts, which requires monitoring.
From fixed autonomous archival recorders to moving near-real-time multi-sensory platforms (Mellinger et al., 2007; Baumgartner et al., 2018), passive acoustic monitoring has proven to be a reliable and suitable mean for baleen whale studies (Howe et al., 2019). However, it is still relatively expensive to deploy conservation-focused hydrophones and despite the research community’s global efforts and the exponentially increasing amount of data collected worldwide (Kowarski and Moors-Murphy, 2021), recorders are sparse and unevenly spread: the oceans are under-sampled (Eguíluz et al., 2016; Ahonen et al., 2017; Ahonen et al., 2021; Hamilton et al., 2021).
Meanwhile, Distributed Acoustic Sensing (DAS) has started to conquer many fields both at sea (Lindsey et al., 2019; Sladen et al., 2019; Williams et al., 2019) and on land (Daley et al., 2013; Parker et al., 2014), with exponential progress in terms of data quality, spatial coverage and bandwidth (Parker et al., 2014; Waagaard et al., 2021). Using an interrogator, DAS technology re-purposes existing dark fiber optic (FO) cables to record nano strain (Culshaw and Kersey, 2008) and has the potential for real-time monitoring over tens of kilometers (up to 171 km (Waagaard et al., 2021)) with a spatial resolution of a few meters (Goertz and Wuestefeld, 2018; Waagaard et al., 2021). Initially applied to geophysical data collection (Schenato, 2017; Hartog et al., 2018), DAS has recently aroused interest with waterborne sound sources, e.g, it has been used for near-surface ship detection and bearing estimation in the Mediterranean sea (Rivet et al., 2021). Quality assessment of the data was performed using controlled airguns sources compared (a) to ocean bottom seismometers recordings in Japan (Matsumoto et al., 2021) and (b) to seismic streamers in Norway (Taweesintananon et al., 2021). Both studies showed similar capabilities between DAS and known instrumentation in terms of frequency response and signal-to-noise ratio (SNR). This article demonstrates the untapped potential of DAS for baleen whale monitoring (Figure 1).
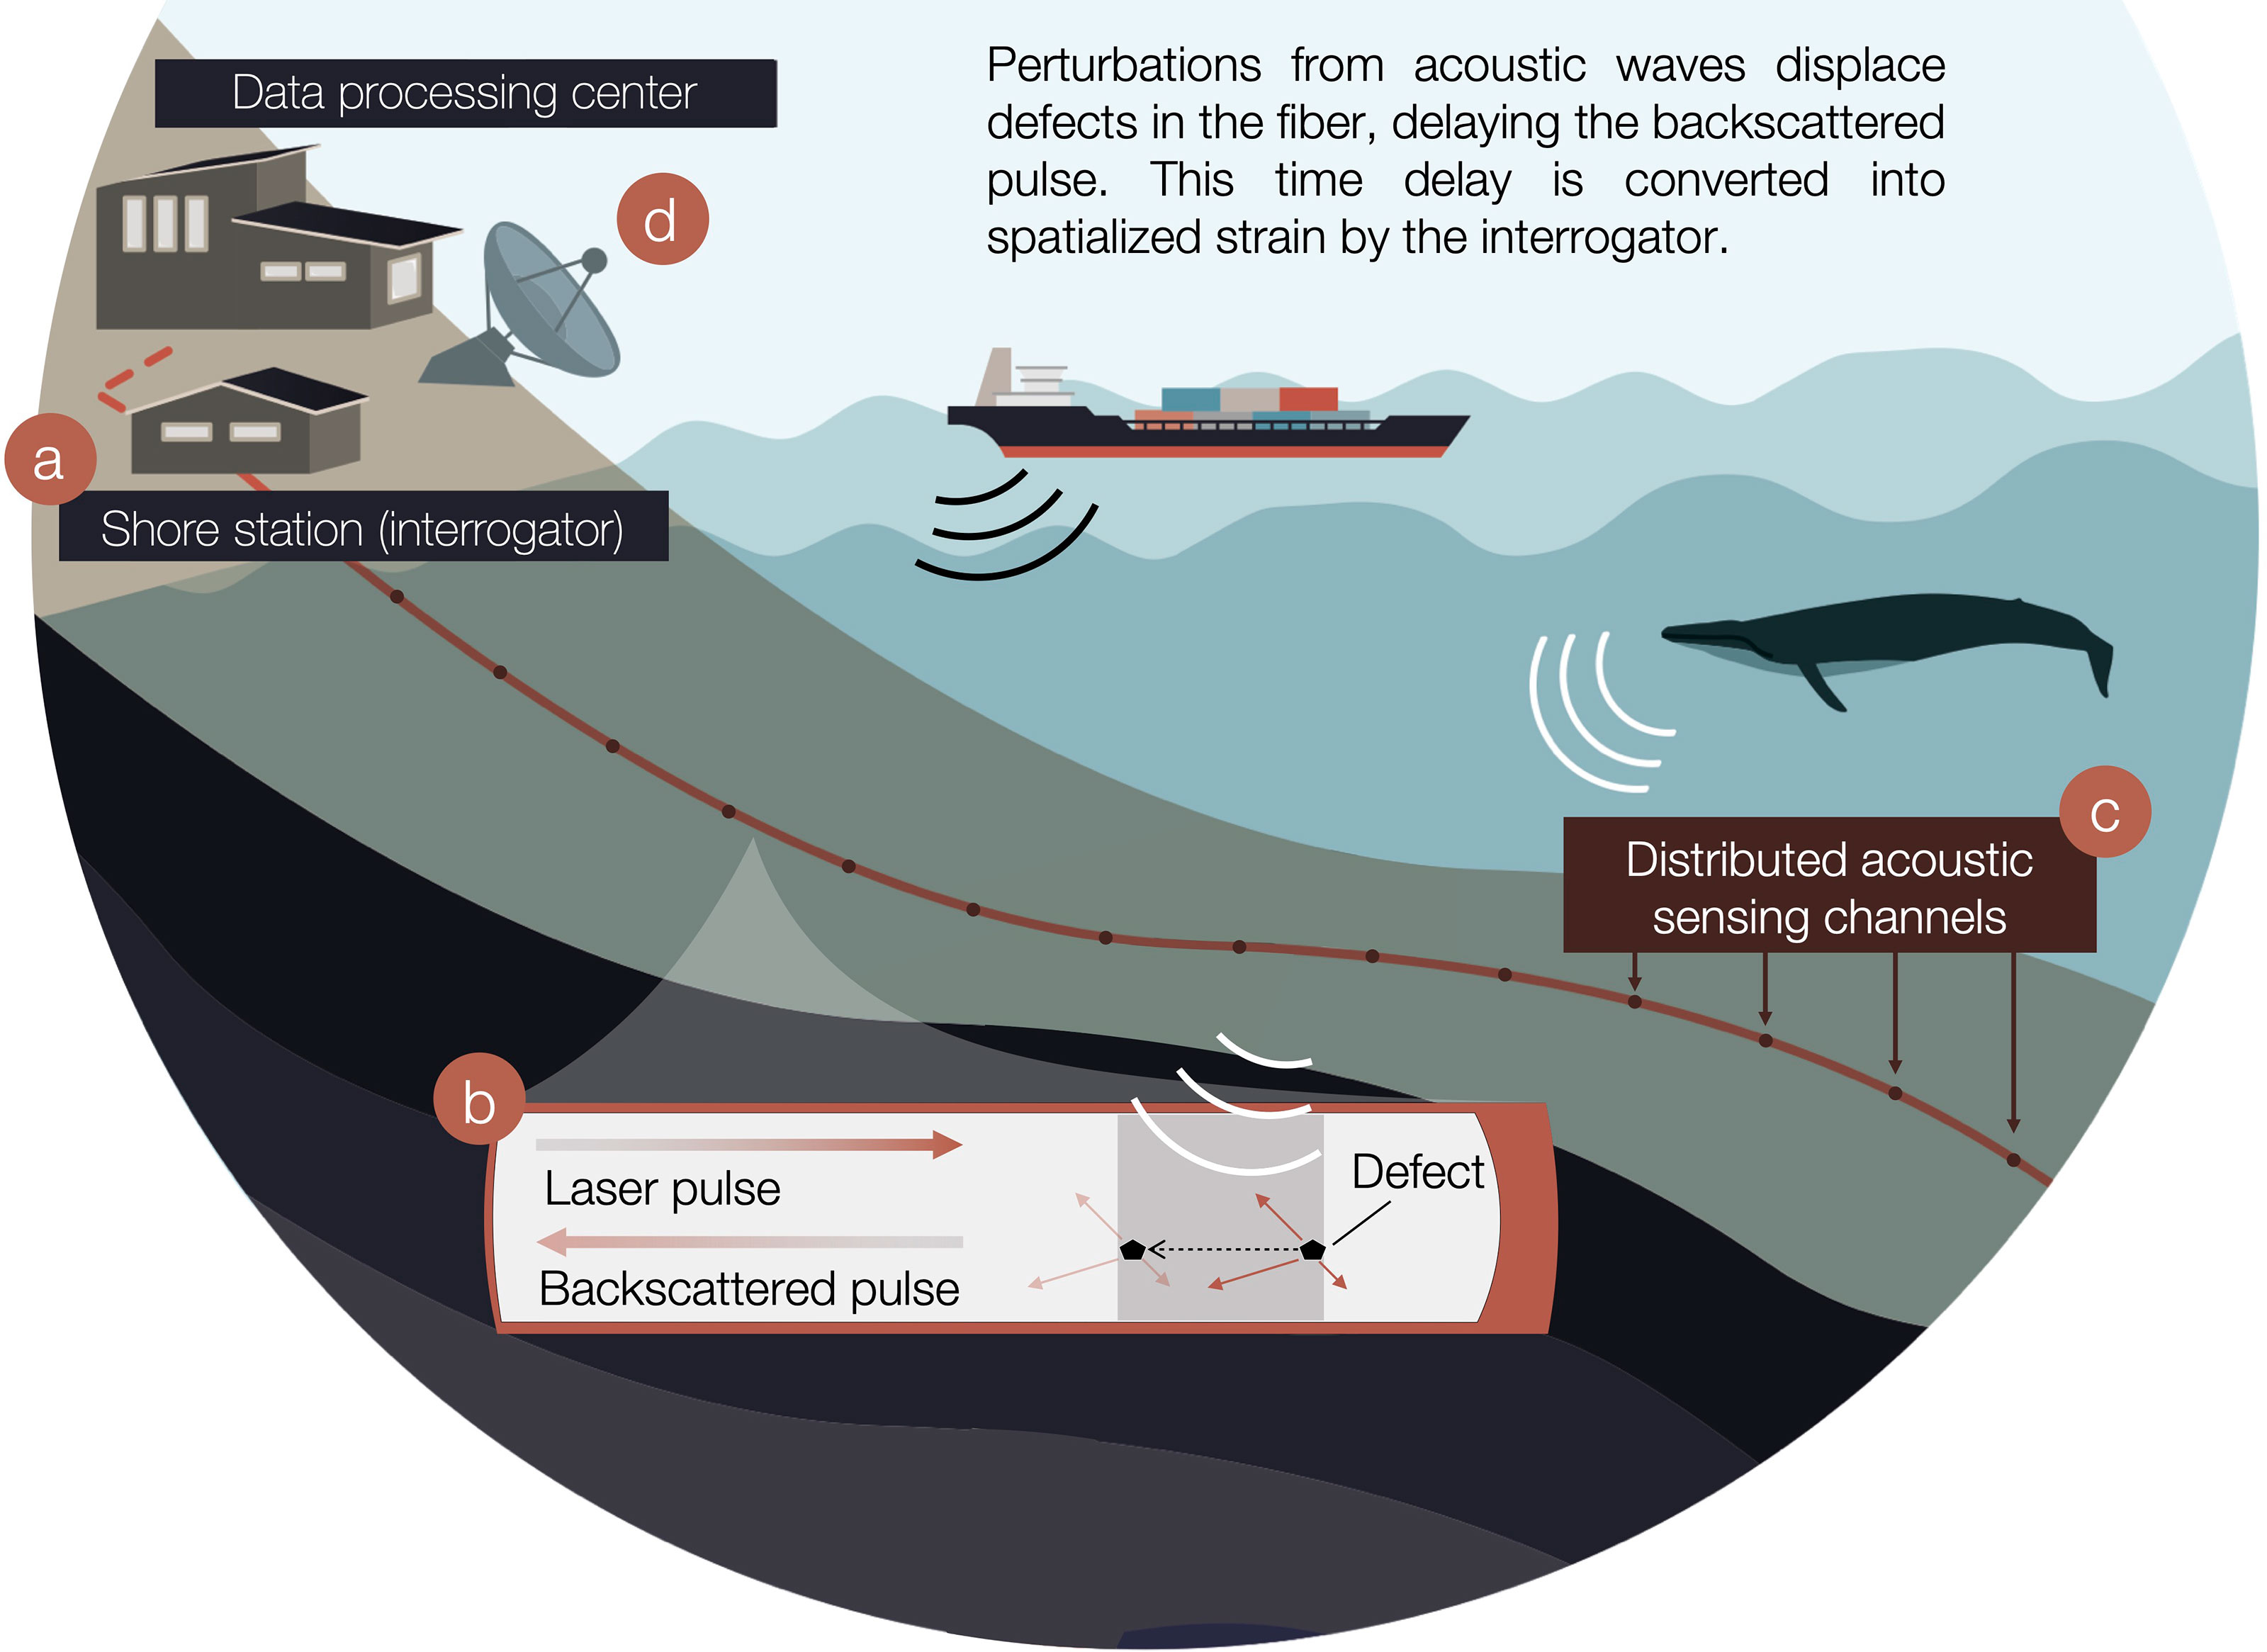
Figure 1 Distributed acoustic sensing (DAS) for baleen whale monitoring. (A) On shore, an interrogator is connected to one end of an existing fiber optic cable to repurpose it into DAS. (B) It interrogates the fiber by sending laser pulses that are backscattered by anomalies while simultaneously, these defects are shifted under the effect of incoming acoustic waves. (C) The interrogator calculates time delays of the backscattered response at regularly spaced intervals along the fiber, named channels. Time delays are averaged over the gauge length and converted into longitudinal strain waveforms analogous to acoustic pressure. (D) DAS two-dimensional data is streamed in near-real-time to a remote data processing center.
Data was acquired during the summer of 2020 around Isfjorden, Svalbard, Norway, at the doorstep of the Arctic (Figure 2). At that time of the year, sightings and a previous acoustic study around the archipelago demonstrate the consistent presence of blue, fin and humpback whales, and possible presence of sei whales (Nieukirk et al., 2020; Ahonen et al., 2021; Hamilton et al., 2021). Raw DAS data used for this work is available in open access (Bouffaut and Taweesintananon, 2022). Note that, to ease the reader in, the Method section (§ 4) is the last section of this article.
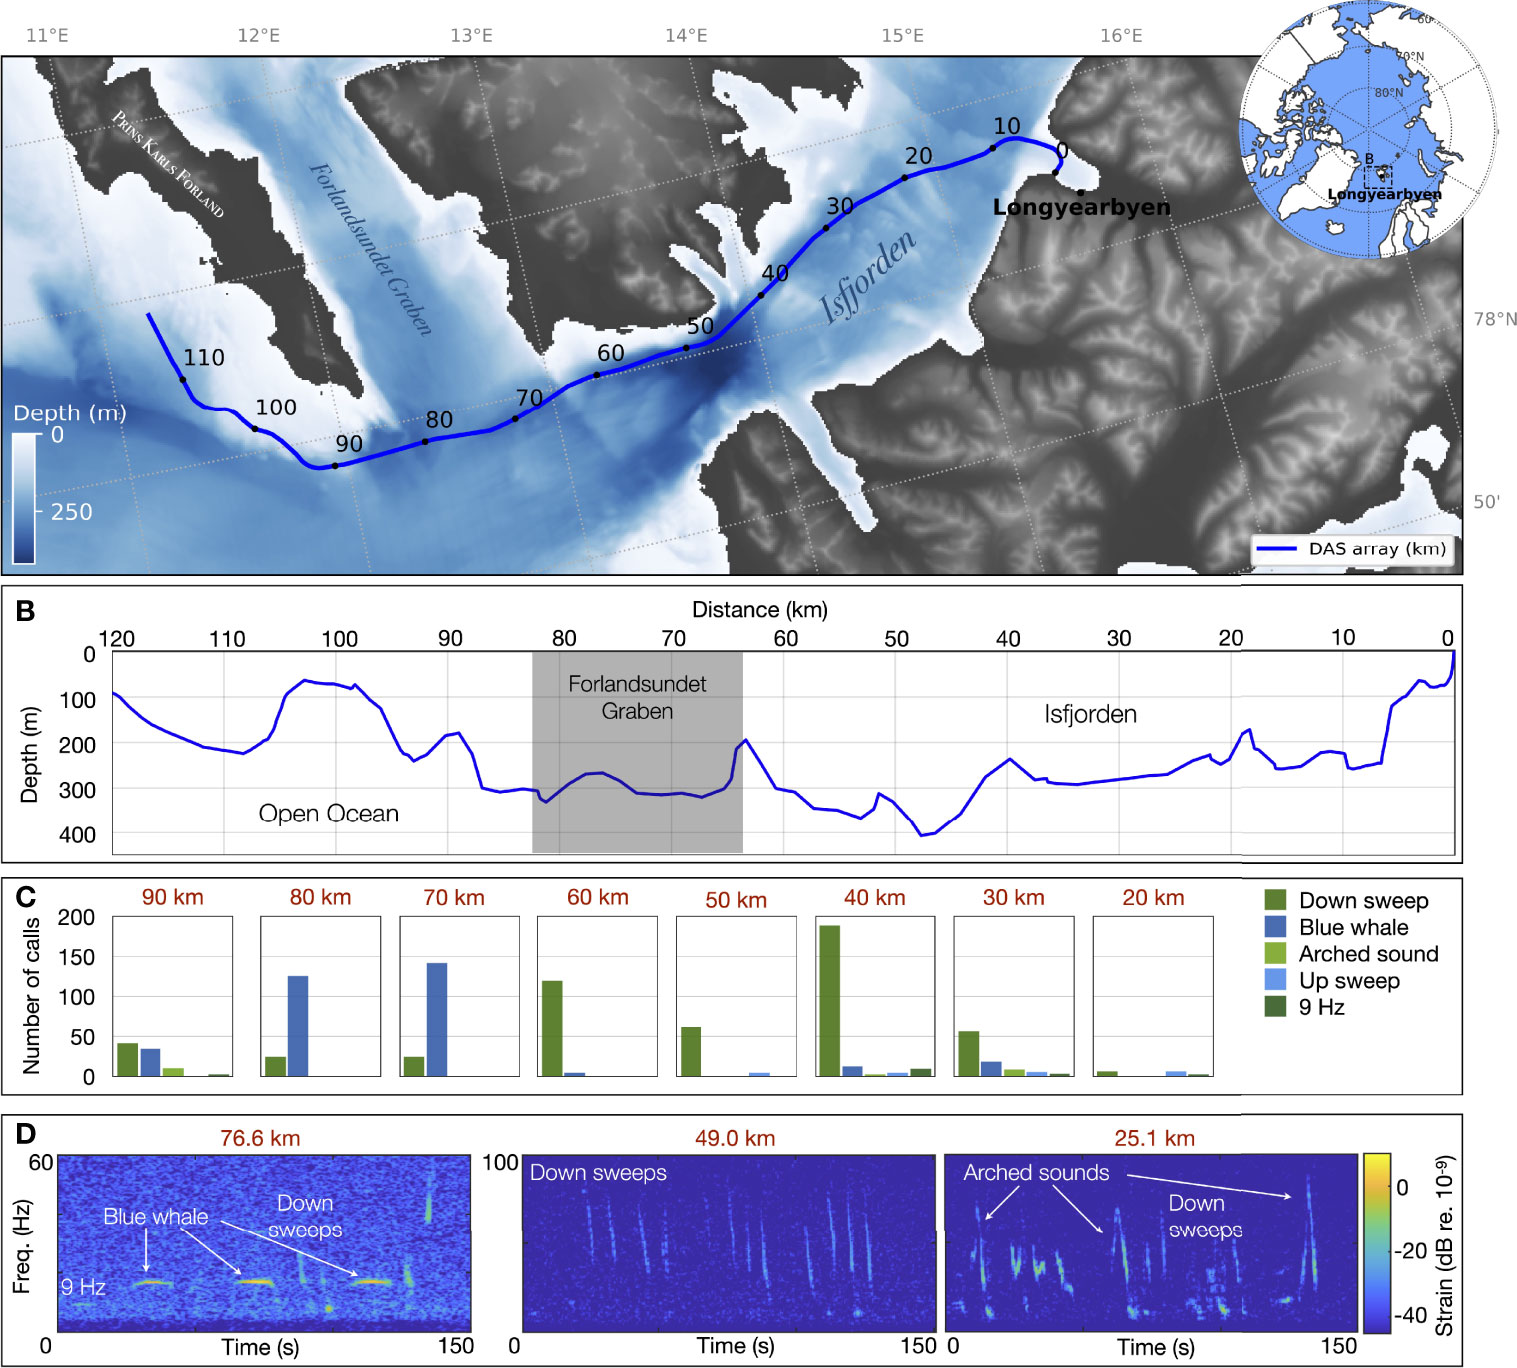
Figure 2 Baleen whale vocalizations detected over the 120 km of the Svalbard underwater distributed acoustic sensing (DAS) array. (A) The DAS crosses Isfjorden out to the open sea, bypassing the South of Prins Karls Forland in Svalbard, Norway. The interrogator end of the fiber is located on shore in Longyearbyen, recording data with a spatial sampling of 4.08 m at a sampling frequency of fs = 645.16 Hz between June 23 and August 5, 2020. (B) The DAS fiber optic cable is trenched 1-2 m deep in the seafloor and follows bathymetric variations with an average depth of ≃216 m. Number of calls (C) and examples (D) representative of the diversity of baleen whale vocalizations detected along the DAS during the entire recording period. Associated sounds are available in supplementary material Audio 1–3.
2 Results and Discussions
2.1 Experimental Setup
It is common practice to lay spare fibers in telecommunication cable bundles to minimize the cost of installation. On shore, one end of such a dark fiber can be tapped without disturbing data streams and, converted into DAS using an interrogator (Figure 1A). The interrogator injects linear frequency-modulated optical pulses which are backscattered by anomalies in the fiber (Waagaard et al., 2021). These defects are displaced at the nanometer scale under the influence of acoustic pressure waves [but also seismic, oceanographic (Landrø et al., 2021)], introducing delays in the backscattered pulse (Figure 1B) (Nishiguchi, 2016). The interrogator calculates the time-differentiated phase change of the backscattered response from consecutive sweeps at regularly spaced intervals along the fiber, further named channels (Figure 1C). The phase change is averaged over a section of the fiber, the gauge length, and converted into longitudinal strain waveforms, analogous to acoustic pressure, for each corresponding fiber section (Hartog, 2017; Taweesintananon et al., 2021). The resulting strain data, sampled in both time and space is streamed in near-real-time from the experiment site to a remote data-processing center (Figure 1D).
In this experiment, we re-purposed a dark fiber (SMF-28 single mode silica) in an existing Uninett submarine telecommunication cable connecting Longyearbyen to Ny-Ålesund in Svalbard, Norway (Figure 2A). The fiber, heading out to the open ocean from Longyearbyen, through Isfjorden was trenched 1 to 2 m into soft sediments all along the used section and, followed the seafloor bathymetric variations (Figure 2B).
The Longyearbyen end of the fiber was connected to an Alcatel Submarine Networks OptoDAS interrogator, converting the first 120 km of fiber into a DAS array. We used light pulses of 1500 nm free-space wavelength with a duration of 100 μs to sample along the 120 km with a 4.08 m spatial sampling, resulting in 30000 DAS channels. In the remainder of the article, we refer to channel positions along the FO cable from the Longyearbyen shore as simply distance, as illustrated on Figure 2. Normal signal strength decay along the fiber is 0.2 dB/km, such that the returned signal strength from 100 km is ≃−40 dB with respect to 1 km. A gauge length of 8.16 m was chosen as a compromise between maximizing the signal-to-noise ratio for the 4.08 m channel spacing (Dean et al., 2017), giving sufficiently large bandwidth for different applications (Landrø et al., 2021) and, optimizing the near-real-time data transmission rate. Data was streamed from Svalbard to NTNU (Trondheim, Norway) in near-real-time via Uninett’s research network, using the 1 Gbit/s network interface of the interrogator. There, the data was recorded at a sampling frequency of fs = 645.16 Hz, providing just over 300 Hz of bandwidth. The DAS data was continuously sampled over 44 days, between June 23 and August 5, 2020 and the experiment generated around 7 TB/day.
DAS instrumentation is not limited to low frequencies but its implementation is constrained by the relationship between the interrogating optical pulse intervals (the inverse of the sampling frequency) and 2-way light travel times along the physical length of the FO cable L such as with clight = 299798458 m/s the speed of light in the fiber and n = 1.4667 the group refractive index of the fiber. For example, a 10 km-long DAS could record up to fs = 10 kHz, without aliasing.
DAS array response to strain for a specific fiber optic/interrogator combination is a function of the gauge length, wave frequency, wave velocity and grazing angle between the source and the receivers. Due to the nature of the coupling between acoustic stress and FO cable strain, a notch in the impulse response of the fiber can be observed for perpendicular arrivals (Taweesintananon et al., 2021). The conversion from strain to acoustic pressure is a linear relation that depends on the Young’s modulus of the seafloor, which varies along the FO cable. During this first experiment, calibration, e.g., using a known and georeferenced active source and co-located hydrophones as demonstrated locally in (Matsumoto et al., 2021; Taweesintananon et al., 2021) was not performed. Therefore, the results are presented in nano strain (adimensional) or in dB re. 10-9. More broadly, the calibration of DAS systems has not yet been systematic and the community is working towards standardization procedures (Lindsey and Martin, 2021).
2.2 Acoustic Data Analysis
A sparse visual and aural inspection of the entire dataset (every 10 km; method described in § 4.1) revealed the presence of different known baleen whale low-frequency signatures along the fiber (Figures 2C, D and Supplementary Audio S1–S3). Of the 832 annotated calls, we identified 38% as North Atlantic blue whale stereotyped signals (AB call, peak frequency at 16.9 Hz; arched sounds, 9-Hz call) conforming to previous call descriptions (Mellinger and Clark, 2003). They were found during the entire recording period with a higher number of calls detected after July 23, 2020. In four instances, sightings from whale-watching tours confirmed the presence of a blue whale in the area. Various species overlap within the observed bandwidth and produce down-sweeps (Ou et al., 2015), that were the most commonly labeled calls (60% of the annotations; peak frequency 45 ± 15 Hz, average duration 5.4 ± 2.4 s). They can be attributed to blue whales [D-calls; high variability but ≃2 s long (Oleson et al., 2007)], fin whales (40 Hz call; a 0.3 s down-sweep from 75 Hz to 40 Hz (Watkins et al., 1987)), humpback whales (non-song frequencies occur under 200 Hz and last between 0.1-4 s. (Recalde-Salas et al., 2020)), but also sei whales [e.g., a < 2 s down-sweep from 80 to 30 Hz (Tremblay et al., 2019; Nieukirk et al., 2020)]. Note that during this inspection of the (raw) unprocessed data, a unique vocalization was rarely found on two 10 km-spaced channels.
North Atlantic blue whale low frequency stereotyped calls were mostly recorded outside Isfjorden, between 70-90 km (Forlandsundet Graben), while non-stereotyped down-sweeps were detected in higher numbers in the more sheltered waters of the fjord. For blue whales, stereotyped calls have been associated with male vocal behavior (song), whereas non-stereotyped down-sweeps (D-calls) can be produced by all males, females and calves and have been associated with group social or foraging contexts (Oleson et al., 2007). No clear fin whale 20 Hz song was detected during the recording period. However, some of the down-sweeps could be fin whale 40 Hz calls, which have been linked to feeding behaviors (Širović et al., 2013; Romagosa et al., 2021). The spatial distribution of these two call types indicates potential variation in habitat use in the monitored area. The call abundance has good overlap with sighting-based models that demonstrate the increasing importance of Isfjord as habitat for large baleen whales in Western Svalbard (Storrie et al., 2018).
The spatially distributed observations provided by DAS add a new dimension to the previous (and ongoing) passive acoustic monitoring of baleen whales in Western Svalbard (Ahonen et al., 2021), highlighting potential variations at an unprecedented scale. However, in regard to the amount of data recorded, i.e., almost 7 TB a day during our experiment, there is a need for big-data processing methods to scan through, detect and classify vocalizations and improve species identification, specifically in heterogeneous call types such as down-sweeps (Ou et al., 2015).
2.3 Changing Perspectives: From Single Point to Distributed Sensing
One of the advantages of distributed acoustic sensing compared to typical single-point sensing is that it provides a continuity of measurement in both time and space, which requires “new” representations of the data. A common representation in the geophysical community is spatio-temporal plots also known as t-x plots, showing temporal variations of the strain along the FO cable (Parker et al., 2014; Lindsey and Martin, 2021). Figure 3 is a spatio-temporal representation of two successive stereotyped blue whale calls (at 70 and 110 s), intertwined with down-sweeps (likely D-calls; at ≃90 , 95 and 127 s) between 68 and 84 km of the Svalbard DAS array, recorded on July 10, 2020 at 035530UTC. One channel of this strain data matrix (at 76.6 km) was used to draw the spectrogram in Figure 2D, starting 50 s earlier than Figure 3. A narrow [15-18] Hz butterworth band-pass filter is applied to the data to enhance the t-x plot’s contrast. Detailed information on the pre-processing of Figures 3 and 4 is given in § 4.2.
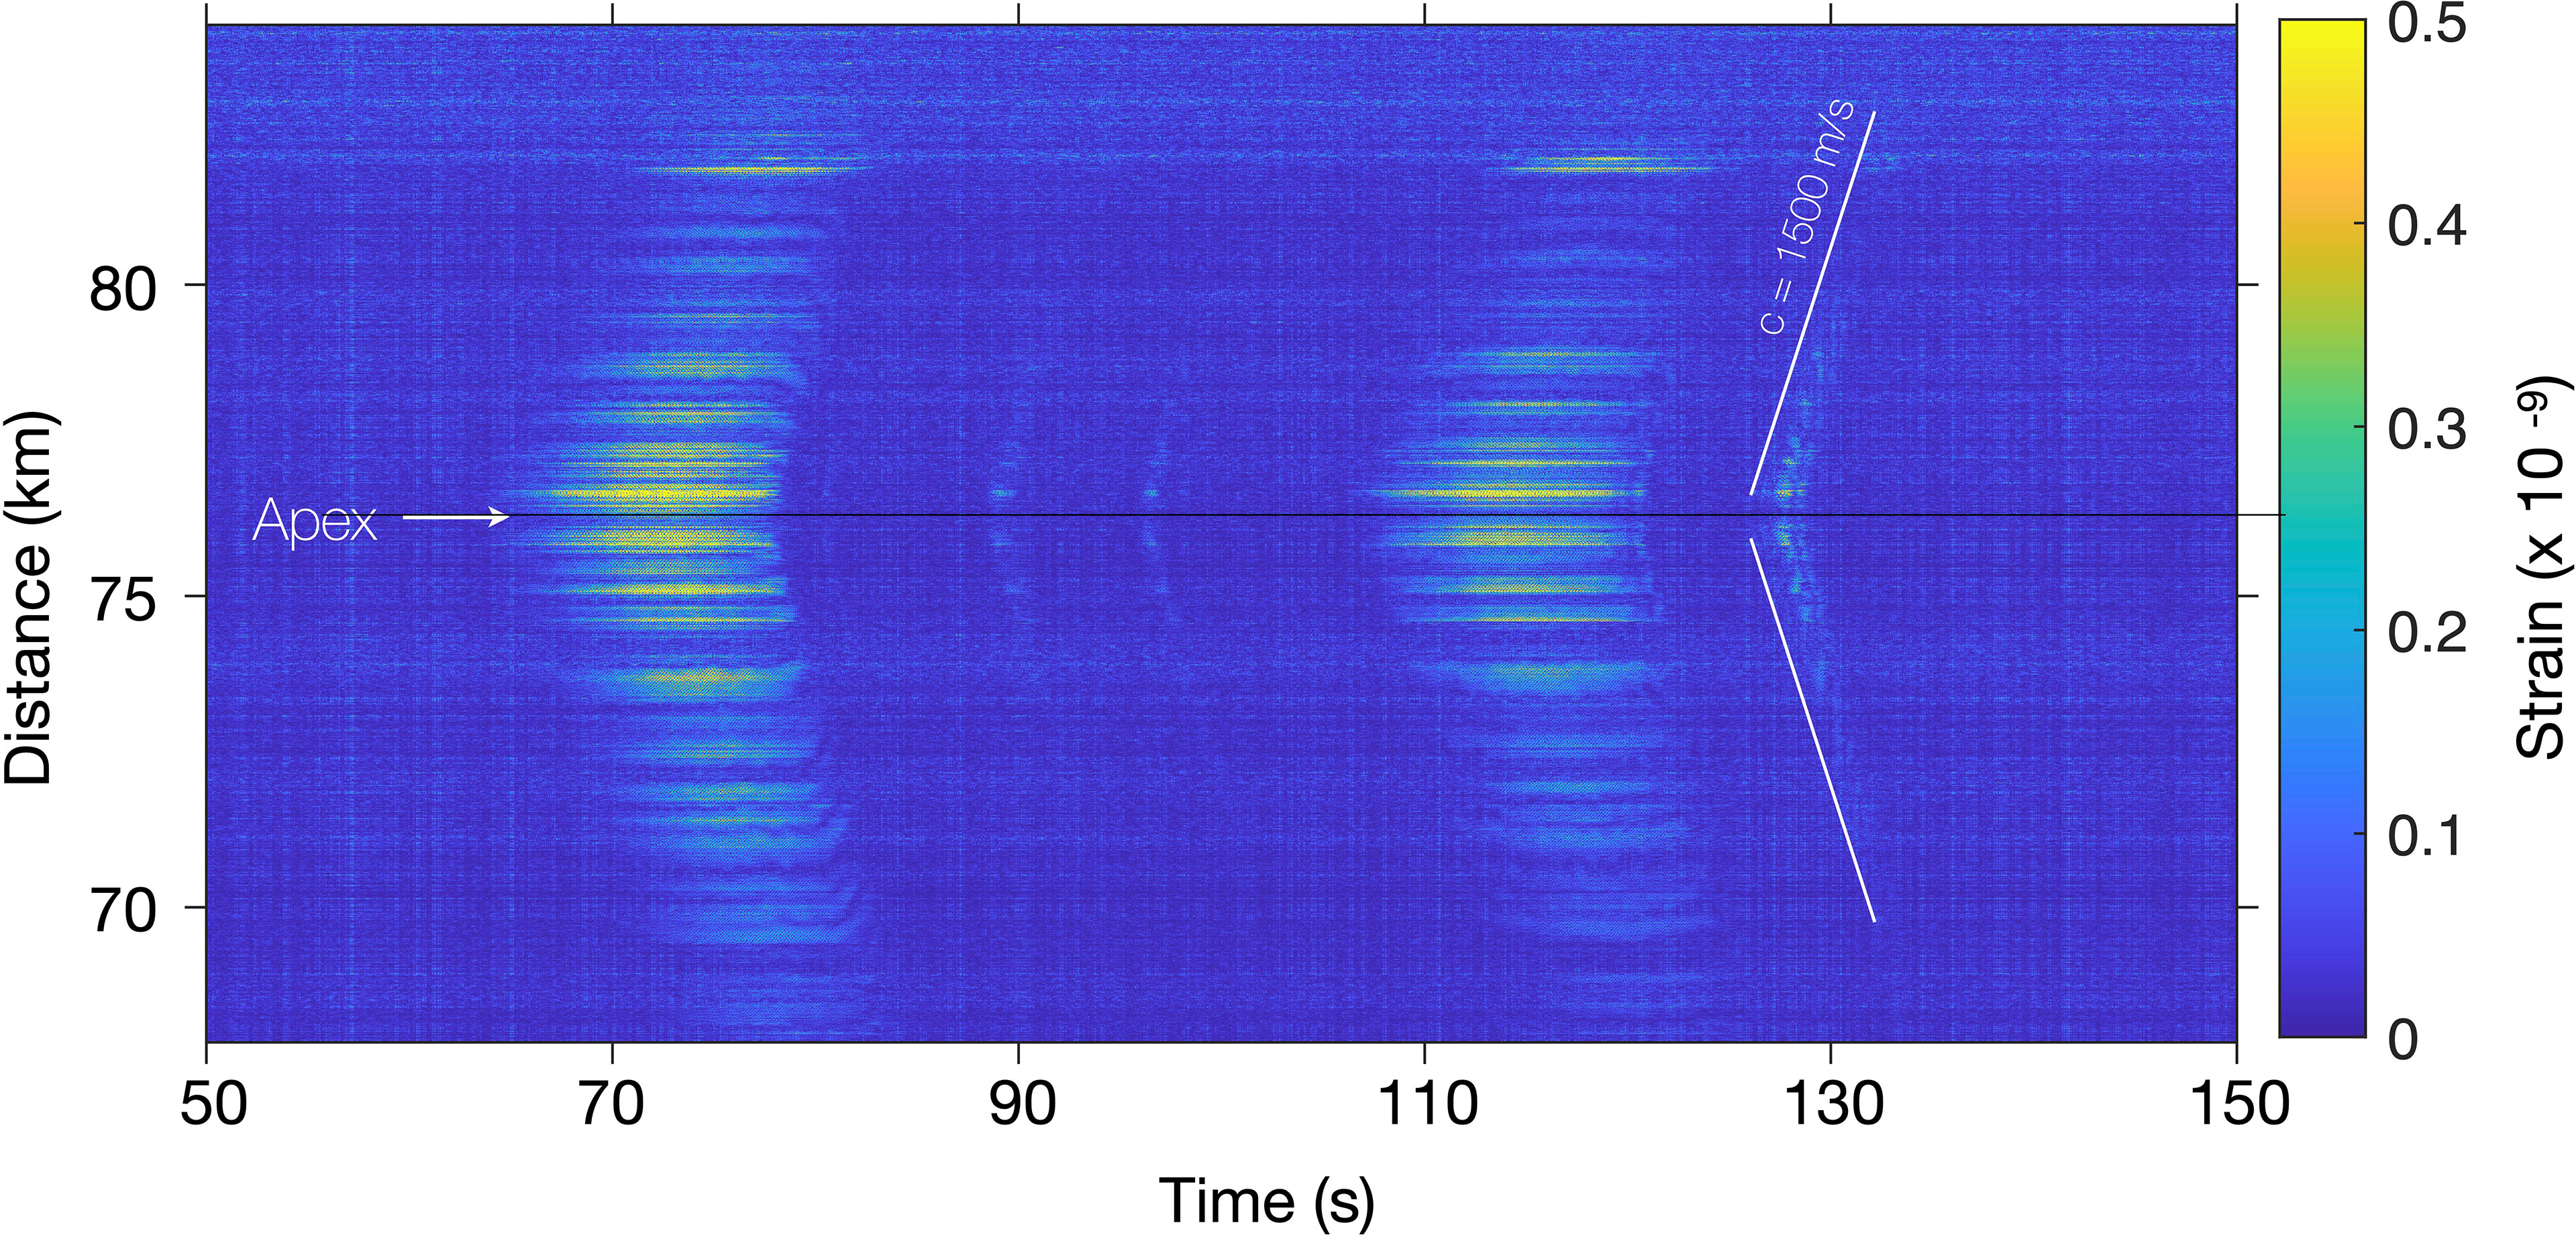
Figure 3 Spatio-temporal representation of blue whale vocalizations recorded on the Svalbard DAS array. The t-x plot displays the temporal variations of the strain between 68 and 84 km of FO cable when receiving two successive stereotyped blue whale calls (at 70 and 110 s), intertwined with down-sweeps (D-calls; at ≃90 , 95 and 127 s) recorded on July 10, 2020 at 035530UTC. The channel at 76.6 km was used to produce for the spectrogram in Figure 2D.
The low-frequency whale vocalizations (< 100 Hz) are transient acoustic signals emitted in the first tens of meters of the water column and observed on a very long array, the Svalbard DAS FO cable, trenched in the bottom of relatively shallow water (< 410 m). Therefore, signals are received only on limited portions of the array [as opposed to DAS recordings of distant earthquakes, received on the total length of an array (Lindsey et al., 2019; Sladen et al., 2019; Landrø et al., 2021)], with time delays corresponding to the difference of travel times between the source and the numerous 4.08 m-spaced channels. These time delays are inherent to the source-channel configuration and the sound speed in the water column. Spatio-temporal representations highlight the time delays on the received signals as hyperbolic wavefront arrivals, whose apex indicates the point on the FO cable closest to the source. In Figure 3 the whale is closest to the channel at 76.3 km, and the single apex location suggests that the series of signals are emitted by a single individual (or a tight group). Benefiting from the pre-processing (§ 4.2), stereotyped signals at 70 and 110 s are recorded on ≃15 km of fiber, contrasting with the detection range of D-calls. This variation could be explained by the narrow band filtering that does not encompass the full D-calls’ bandwidth and potential differences in source levels. Note that the slope of the down-sweep hyperbolas tends towards sound speed away from the apex. The received strain amplitude decay is not constant along the fiber which can be interpreted as (1) DAS directivity & local variations in the coupling between the fiber and seafloor (Matsumoto et al., 2021; Taweesintananon et al., 2021), (2) Coherent interferences in the wavefield due to a near-surface source (Lloyd’s mirror effect) (Carey, 2009; Bouffaut et al., 2021), (3) Upward refracting trends in arctic waters sound propagation, with potential shadow zones and complex fjord and coastal 3D propagation (Jensen et al., 2011). Instrumental vertical and horizontal noise lines appear on the t-x plot. They could be removed with an additional pre-processing step, such as filtering in the frequency-wave number domain (known as f-k filtering) to keep only signals propagating at the speed of sound (Lindsey et al., 2019).
Figure 4 presents 130 s of recording on June 27, 2020 at 052440UTC, between 35 and 90 km of the Svalbard DAS FO cable. It reveals the presence of at least 3 individuals at different locations along the cable, indicated by the dashed lines and numbers. Figure 4A is a spatio-temporal representation of the strain measured along the FO cable, in absolute value and separated around the mouth of the fjord at 62.25 km. To enhance the contrast, the signal out of the fjord (62.5-90 km) is band-pass filtered in the frequency domain between [16.7–17.2] Hz in (Figure 4A), highlighting the contribution of North Atlantic Blue whale stereotyped signals while it is band-pass filtered between [30-43] Hz to enhance down-sweeps inside the fjord (35–62.5 km). Lines with a 1500 m/s slope are added to (Figure 4A) to highlight the received signals.
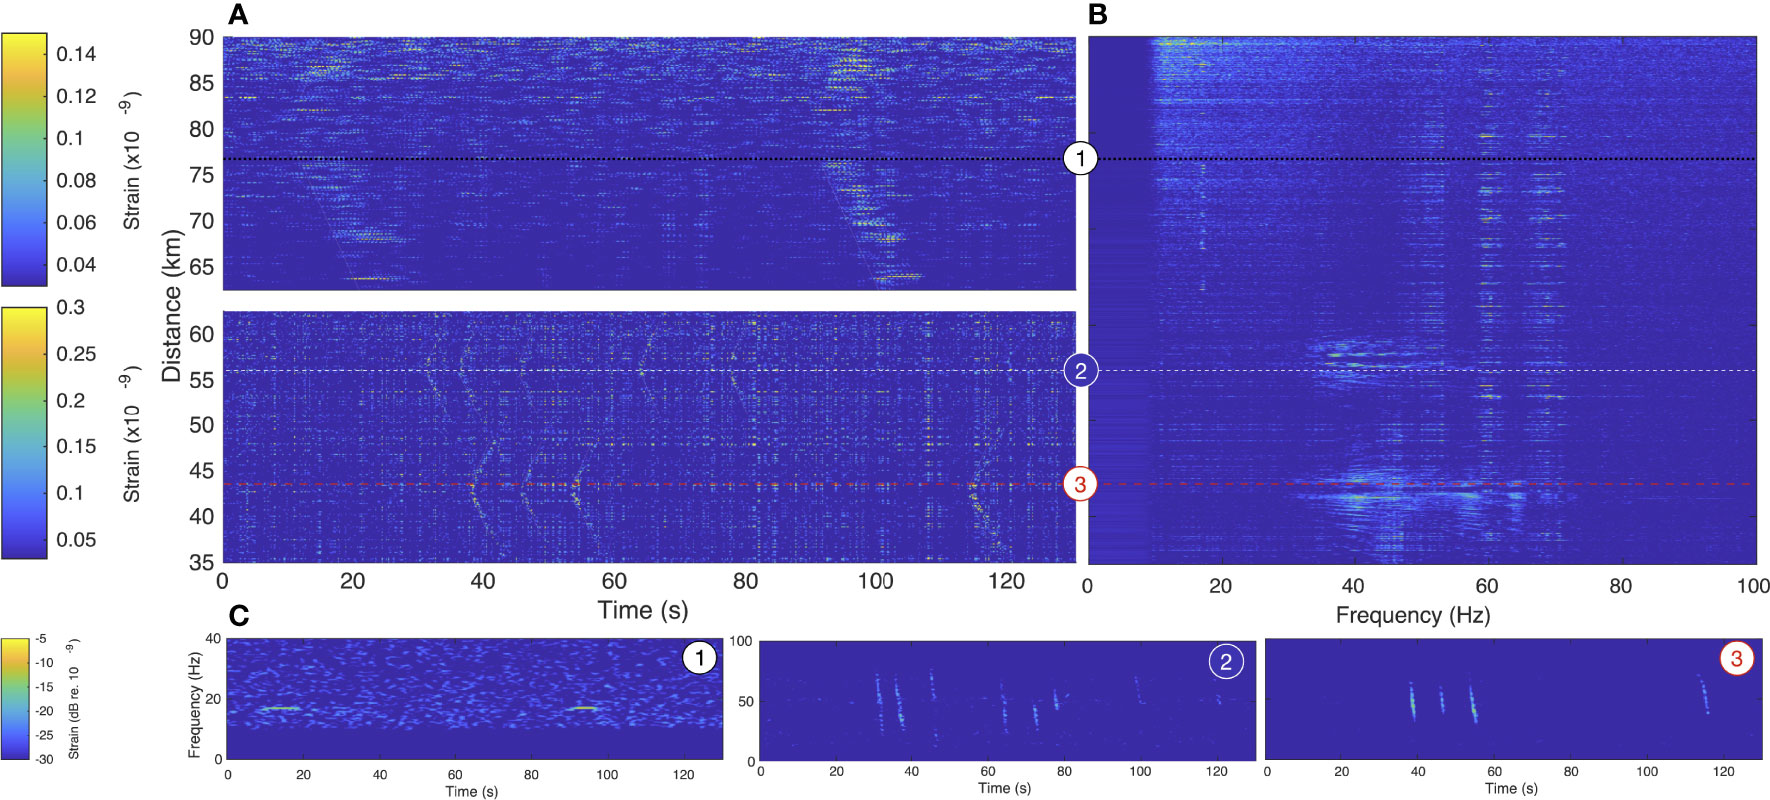
Figure 4 Vocalizing baleen whales recorded simultaneously at three different locations along the Svalbard DAS array. (A) Spatio-temporal (t-x), (B) Spatio-spectral (f-x) and (C) Spectro-temporal (spectrogram) representations of a 130 s-long portion of recording from June 26, 2020 at 052440UTC, between 35-90 km of fiber optic cable. Each whale position (around 76.5 km, 57.5 km and 44.2 km) is given a number 1-3, to facilitate panel associations.
A 16.9 Hz North-Atlantic blue whale signal is received on all represented channels outside the fjord over 27 km Figure 4A. The apex indicates that the vocalizing individual is closest to channels at ≃77 km. In the fjord, the down-sweeps are recorded over ≃5 km around the apexes, indicating two distinct vocalizing positions around 57 and 44 km. Figure 4C are spectrograms of the strain content recorded at 76.54, 57.46 and 44.22 km (Distances represented by the dashed lines from matching numbers), averaged over 2 juxtaposed channels (4.08 m apart) for noise removal and displayed in dB re. 10-9. The channels used to compute the spectrograms are chosen near the apex to maximize the received amplitude.
Different features are considered to identify the calling species such as the rhythmic or inter-call intervals, the intensity or received levels, the contours in the time-frequency domain. However, the decisive characteristics to classify baleen whales is the spectral content of the signal (McDonald et al., 2006; Širović et al., 2017). We therefore propose a spatio-spectral representation of the DAS recordings or f-x plot, as employed in (Rivet et al., 2021), to show the spectral signature and its evolution against the distance. The method is detailed in § 4.3. An animation, showing the successive 2-s f-x plots is available in supplementary material Video S1 while the integrated representation, over the 130 s of recording is displayed in Figure 4B with a time window duration of 2-s and 4096 samples fast Fourier transform, resulting in a f-x matrix with a frequency resolution of 0.16 Hz. For the three distances along the FO cable where signals were emitted, the measured bandwidth gives an indication on the species: for example, the clearly tonal signals around 70 km can be easily identified as Blue whale stereotyped call. At the two other locations, they cover a wider band, between 35-60 Hz around 57 km (whale 2) and wider 30-70 Hz around 42 km (whale 3). The received signals also show pattern of multi-path coherent interferences (e.g., notches on signals coming from whale 2), modulated by the FO cable reception sensitivity null.
Figure 4 reveals the full potential of DAS: it can simultaneously record vocalizing individuals over tens of kilometers from a protected fjord area out to the open Ocean, despite varying noise conditions. In addition to the change of environment, the increase of background noise along the length of the FO cable is due to the attenuation of the optical interrogation pulses. It can also be the effect of changes in the coupling between the FO cable and the seafloor (Matsumoto et al., 2021). The calibration of the system would enable the conversion of the measured strain into acoustic pressure, providing measurement of ambient sounds at the regional scale. The spatial distribution inherent to DAS also opens localization and near-field beamforming possibilities (§ 2.4).
2.4 Localization, Tracking and Beamforming
The localization problem is seen as an optimization process that aims to find the best match between measured and theoretical time difference of arrivals (TDOA), estimated for different source positions (varying closest FO channel and range). Successive positions are linearized for individual tracking and the time delay information is used for near-field beamforming. The method is described in § 4.4. It was previously ground-truthed using acoustic signals received from a cargo ship and corresponding Automatic identification system (AIS) positioning, crossing the Svalbard DAS array at 86.6 km (Landrø et al., 2021).
The localization, tracking and beamforming method is illustrated in Figure 5, using a long (more than 10 min) recording with noticeable movement of a blue whale. t-x plots of portions of the recording containing calls and corresponding beamformed signals are represented. The white line indicates the variation of the estimated position of the whale along the FO cable (xw) in time, moving from 86.4 to 87.5 km with an apparent speed of 5.4 km/h. The estimation of the range was not as precise as xw, with a maximum of 700 m and the closest calls emitted (between 420-520 s) within a ≃100 m range. Considering the few numbers of points, no specific trend emerged, so the beamforming is set for a 200 m range. The resulting spectrogram shows a combination of singular stereotyped unit and D-calls, emitted in series, likely from the same animal.
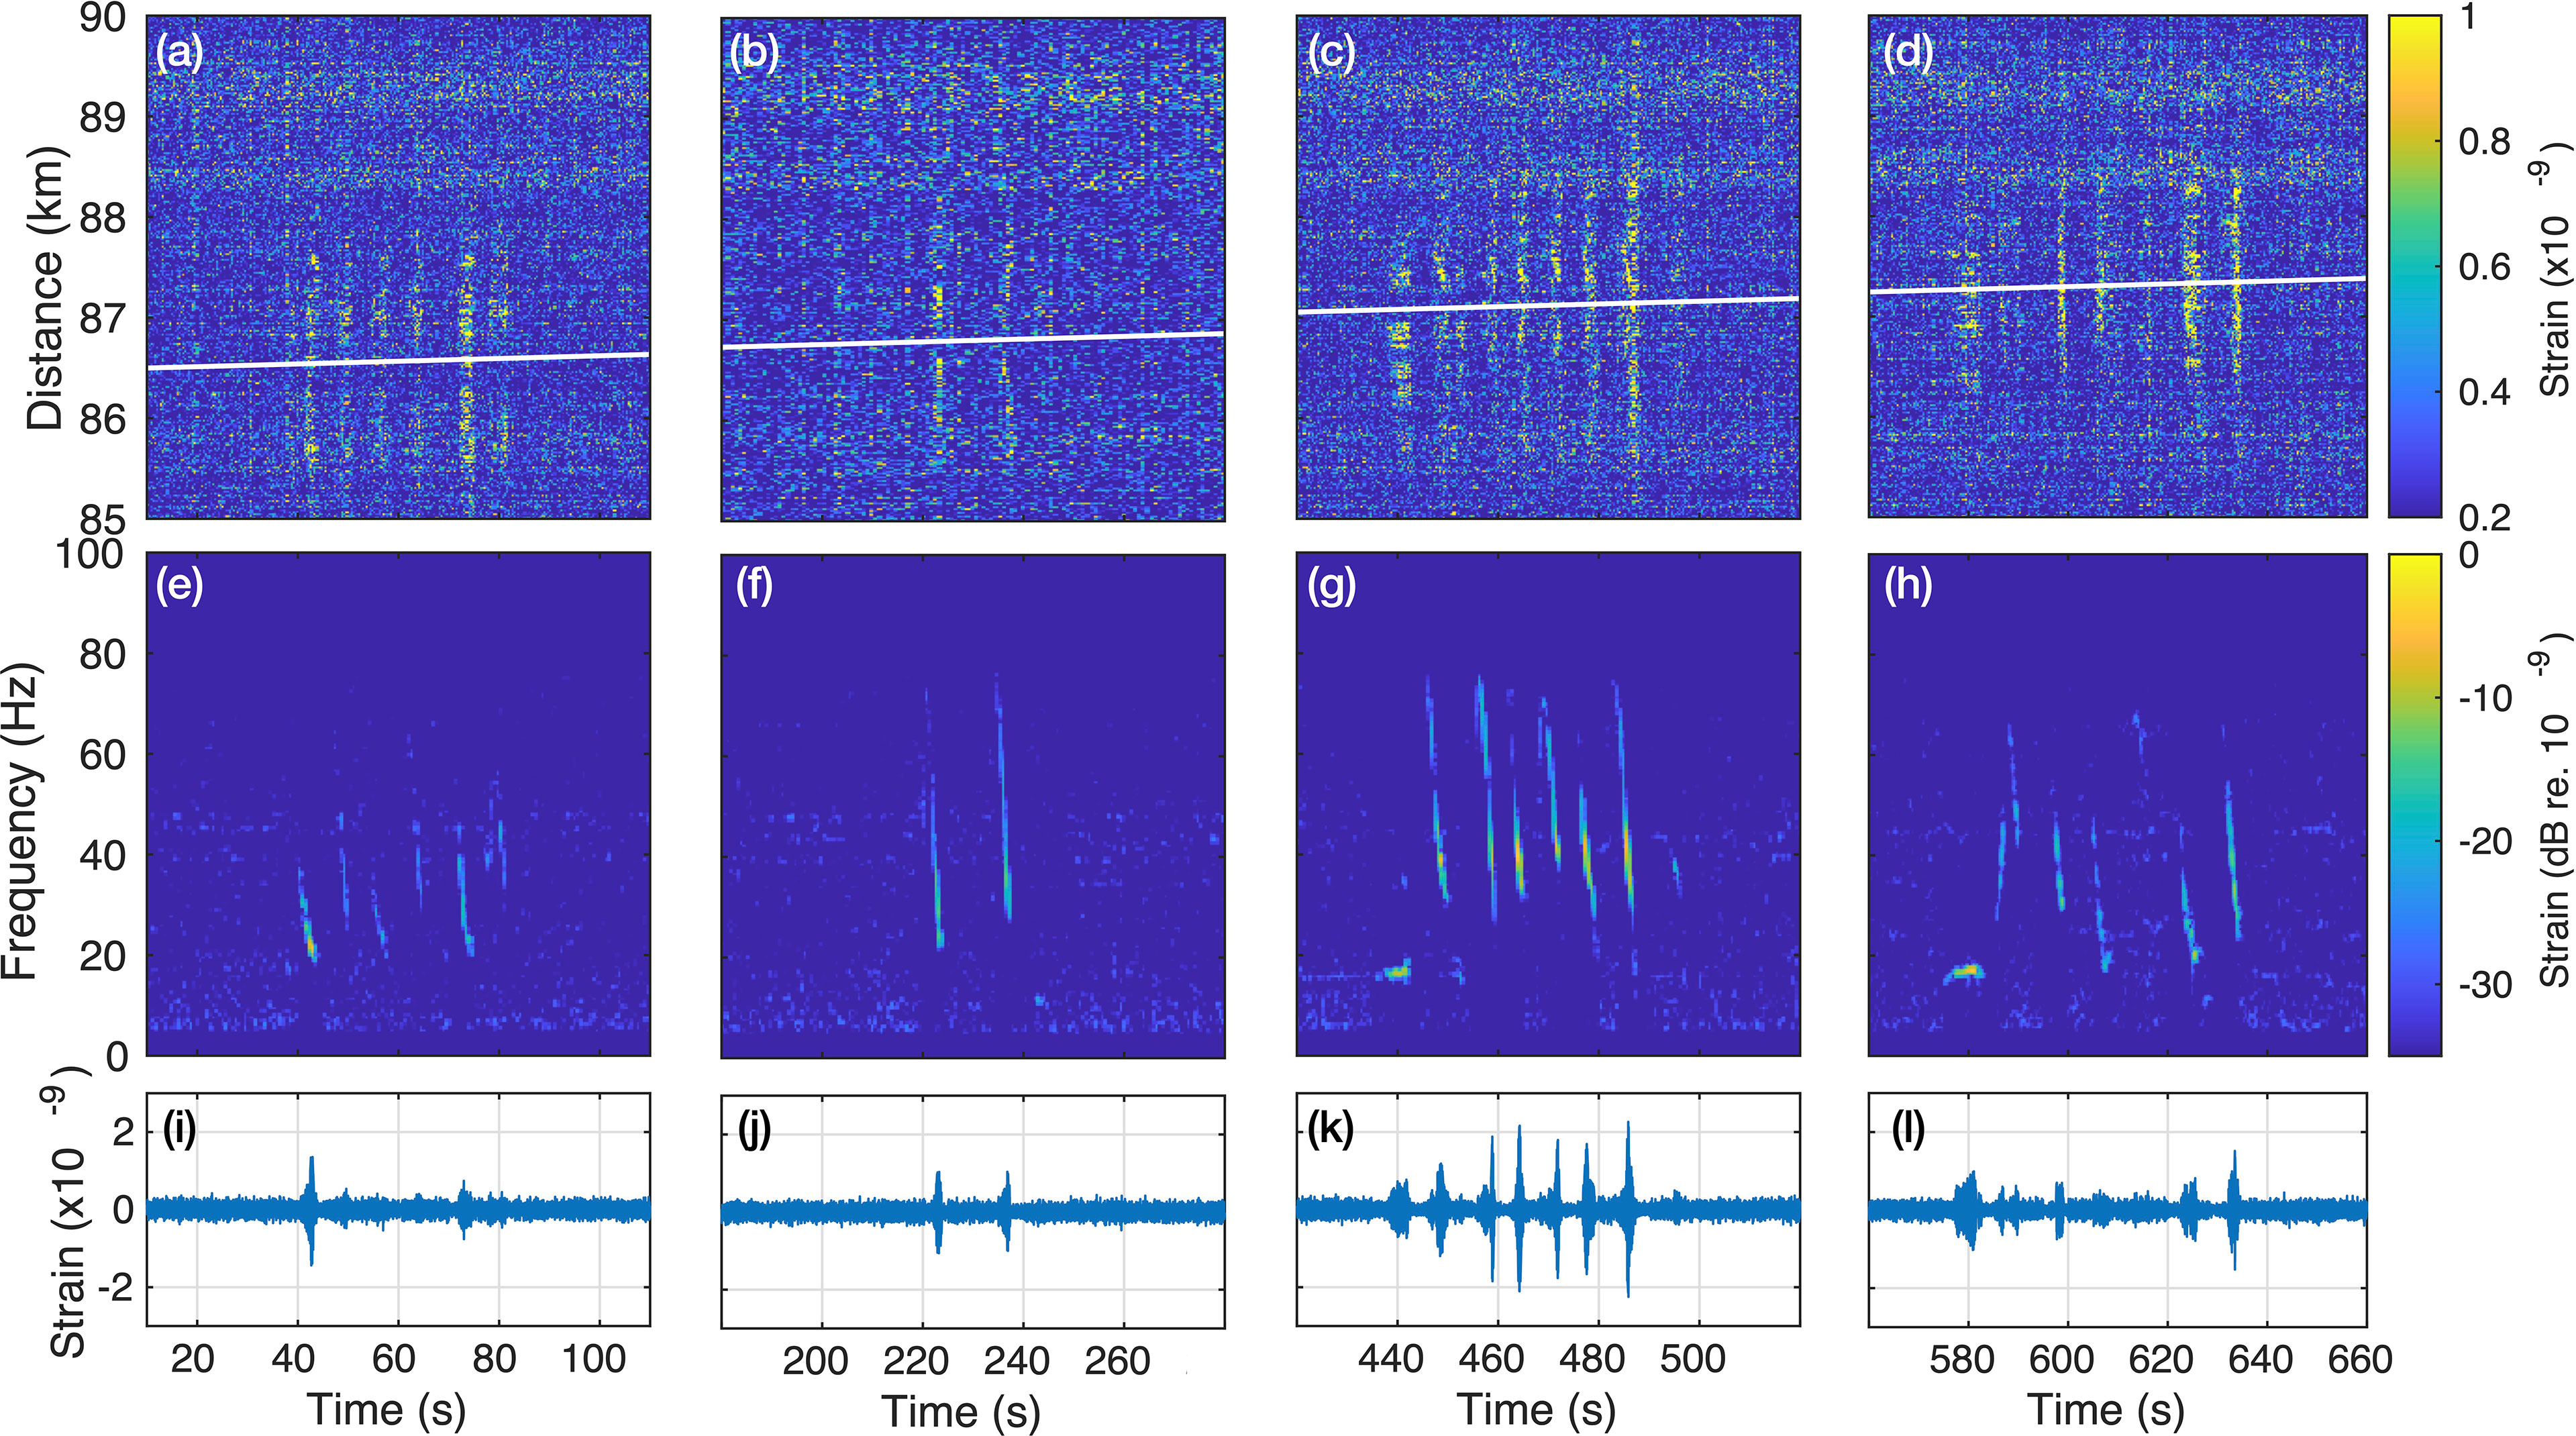
Figure 5 Tracking and beamforming of series of blue whale calls recorded with a moveout on the Svalbard DAS array. (A–D) Spatio-temporal (t-x) representations of the recorded observation where the white line indicate the tracking of the apex, beamformed signals’ spectrogram (E–H) and waveforms (I–L), displayed as successive 100 s-long windows. The audio associated to (C, G, K) is available in supplementary material Audio S4.
The estimated apparent swim speed of 5.4 km/h is a minimum as the actual value increases with the angle between the FO cable and the whale’s trajectory (which might not be a straight line). Nevertheless, it is within the bounds of transiting swim speeds reported for blue whales on feeding grounds, between 2-8 km/h (Bailey et al., 2009; Hucke-Gaete et al., 2018), and consistent with the behaviors associated with stereotyped singular unit and D-call vocal production (Oleson et al., 2007). A variation can be observed in the bandwidth of the beamformed down-sweeps between the successive panels Figures 5E–H. Besides the natural variability of D-calls, these could be introduced by the range xw = 200 m used for the beamforming as well as the inter-channel amplitude variability (as observed in the received amplitudes Figure 3).
TDOA measured from D-calls are narrower than TDOA from long blue whales stereotyped calls and generally provided higher cross-correlation coefficients, ensuring better estimates of xw. In addition, refining the range estimation would increase the resolution of the localization process and improve the beamforming. The FO cable is close to a straight line on the portion used for the localization, introducing a left/right ambiguity. This issue could be solved in Svalbard by instrumenting another already-installed FO cable running parallel to the used FO cable, only a couple of kilometers away. More generally, localization improvements require a georeferenced source to calibrate and test algorithms. Such information could be obtained using an active source, e.g., during DAS calibration experiments. Without this information, our take was to use the acoustic signal from a ship and its AIS positioning (Landrø et al., 2021). However, ship signals are continuous while whale calls are transient, requiring a different initial processing step. Another option to keep the experiment entirely passive could be to use acoustic bio-logging with Global Positioning System (GPS), combining rich information from calling individuals and their behavior to DAS observations (Oleson et al., 2007; Lewis et al., 2018).
The example in Figure 5 demonstrates that whales passing over or near a FO cable can be detected and tracked. The information can subsequently be employed to, e.g., estimate the number of individuals in the vicinity of the array for animal density estimations and, overall, contribute to safer human/whale interactions. Figure 5 also shows that the high SNR gain available from extended aperture array processing can be used to construct high-quality audio waveforms (Audio S4), with interest, e.g., for subsurface exploration (§ 2.5).
2.5 Subsurface Exploration
Recent work demonstrated that recordings of fin whale vocalizations by seabed vibration sensors contain seismic responses to subsurface geologic structures (Kuna and Nábělek, 2021). The fin whale song produced by males is composed of series of repeated short and low frequency pulses that share similarities with airgun blasts (Watkins et al., 1987; Croll et al., 2001) and when produced at different locations (e.g., while traveling) in the vicinity of a single sensor, they can be used for a common receiver song gather (Kuna and Nábělek, 2021). Concurrently, DAS has demonstrated its ability to produce seismic images of the subsurface geologic structures using conventional sources (Taweesintananon et al., 2021). This section investigates the combined use of a non-stereotyped single whale down-sweep and DAS to provide interpretable seismic profiles at two locations along the FO cable. The method is detailed in § 4.5.
Figure 6 displays correlated seismic profiles (Figure 6A,B) and associated received interference pattern introduced by the sea surface [Figure 6C, D; Lloyd’s mirror effect (Carey, 2009)] obtained from two down-sweeps: one inside Isfjorden (Figure 6A–C) around 25 km of FO cable (Figure 2D, last call) and the other around 87 km of FO cable (D-call at 458 s on Figure 5) in Forlandsundet Graben (Figure 6B, D). The water depth at both location is ≃260 m explaining similar first arrival times (direct waves). The analysis and modeling of the interference patterns (Figure 6C–D) show a good match for a ≃20 m source depth, in the bounds of reported values for blue whales (Oleson et al., 2007; Lewis et al., 2018). Specifically source depth and range are set at zw = 15 m and rw = 40 m for the call emitted inside the fjord (Figure 6A) and zw = 20 m and rw = 110 m in Forlandsundet Graben (Figure 6B).
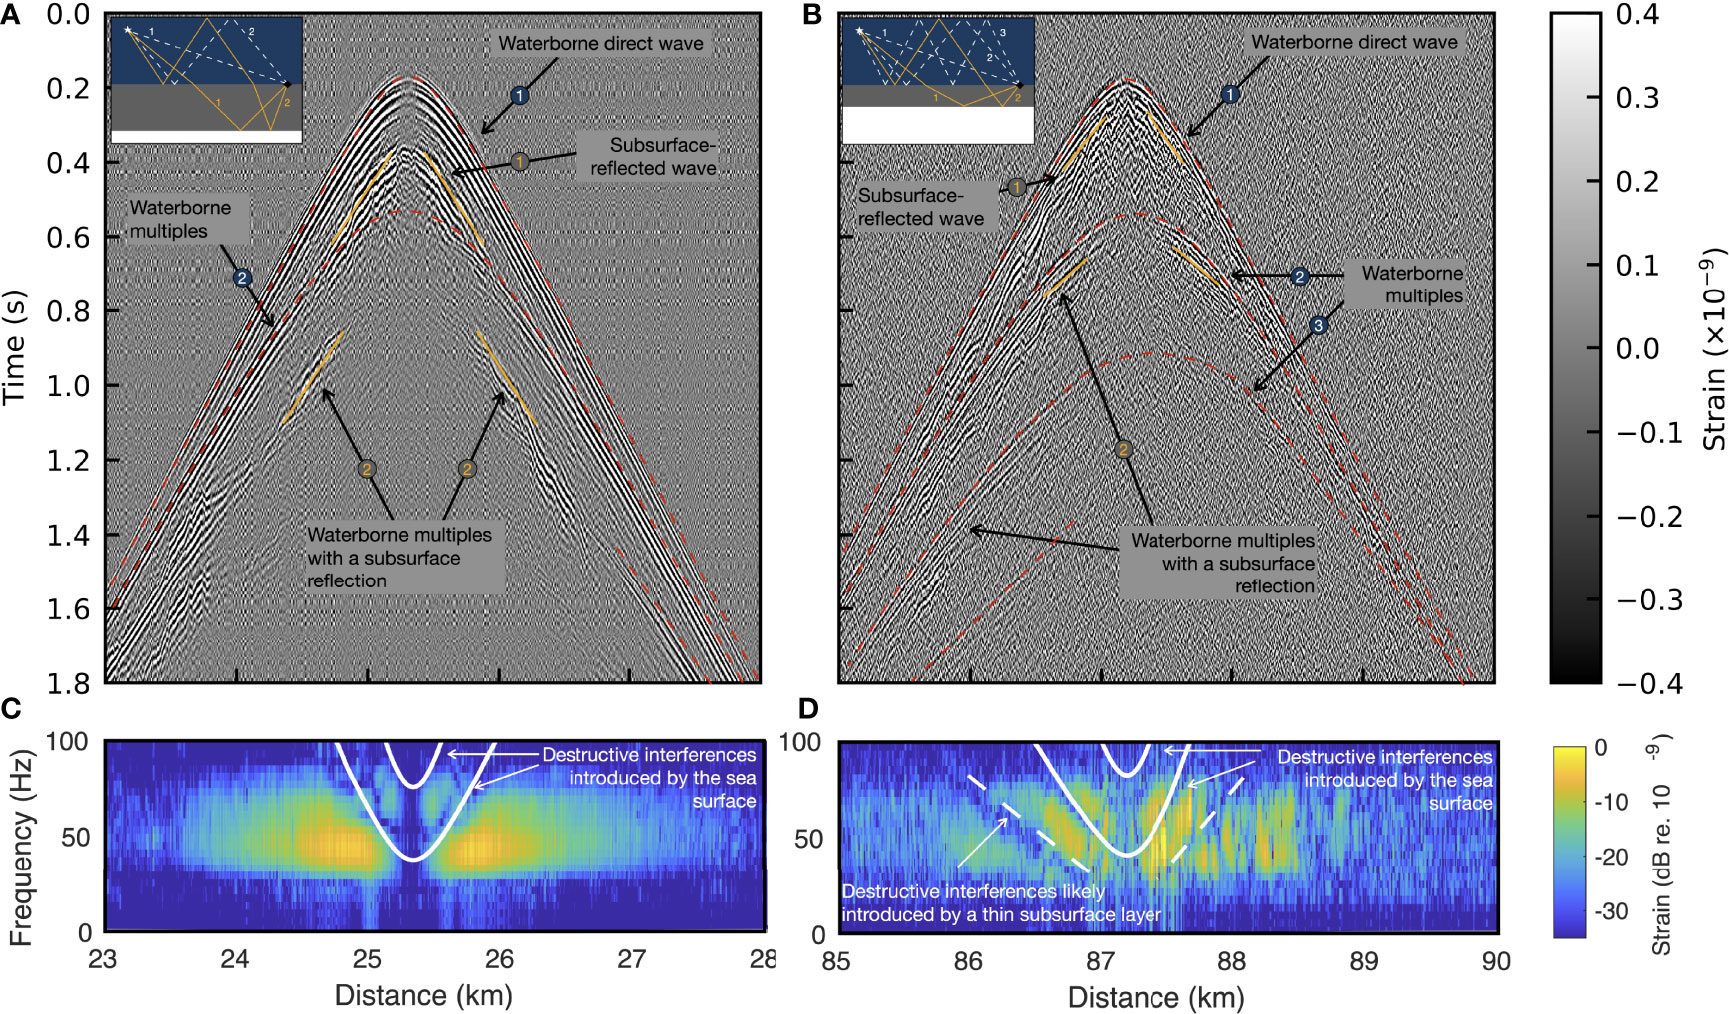
Figure 6 Correlated seismic profiles from non-stereotyped whale calls. Analysis of a D-call (A, C) inside [last from Figure 2D (25.1km] and (B, D) outside (at 458 s on Figure 5) Isfjorden. (A, B) correlated seismic profiles at different locations. Key seismic events are highlighted and described by schematic Earth’s models in the insets. Observed and modeled interference patterns generated by (C) the sea surface (D) the sea surface and a thin sub-surface layer.
The correlated call profiles show direct waves, subsurface reflections, and strong water-layer multiple reflections, annotated on both panels. Comparing the sub-surface reflected waves at the two locations shows longer travel times in Isfjorden (Figure 6A) than in Forlandsundet Garben (Figure 6B), indicating a thicker shallow sedimentary rock layer in the fjord (see insets). The short-time subsurface reflections on the thinner layer of Forlandsundet Garben occur in the interference analysis window (110 ms), introducing additional lower frequency interference notches in (Figure 6D). Two and three (respectively Figures 6A, B) waterborne multiples are visible in the call profiles, indicating higher stiffness of the seafloor in Forlandsundet Garben due to different surface geology, matching traditionally-obtained subsurface structural models (Blinova et al., 2009, Figure 5F) (Asghar, 2011; Blinova et al., 2012) and reference seismic images (Schaaf, 2018, Figure 47) for the area. The subsurface primary reflection events observed in these two call profiles are reflected shear waves, which are probably corrupted by refracted shear waves from the same interfaces.
Figure 6 demonstrates that each whale frequency-modulated call recorded by DAS can be used to provide conventional seismic records for subsurface exploration. If produced and recorded at multiple locations along the array, we would obtain multiple seismic shot profiles sufficient for subsurface imaging. This example goes further than the proposal made by Kuna and Nábelek (2021) to use stereotyped fin whale male song in its use of non-stereotyped vocalizations such as D-calls, produced by all individuals in various baleen whales species (Oleson et al., 2007; Ou et al., 2015). We show that in areas where vocalizing baleen whales and DAS overlap, seismic exploration could be replaced - at least partially - by an entirely passive method keeping the environment and ecosystems undisturbed and unharmed. Therefore, DAS could reduce human activities and anthropogenic stressors such as noise in the oceans.
3 Conclusions and Perspectives
Portions of the 1.2 million km of FO cables installed at the bottom of the world’s oceans can be converted into DAS using off-the-shelf interrogators. We demonstrate through this work that, with tailored filtering, analyzing, and visualizing methods, DAS can provide cost-effective data for passive acoustic conservation with an unequaled and unprecedented spatial coverage and resolution. As a result, we are on the brink of a revolution.
However, there are a few challenges to overcome to enable worldwide eavesdropping at the speed of light. Regarding the instrumentation, telecommunication FO cables belong to various entities and require specific agreements to be accessed and tapped1.
Because the primary purpose of these fibers is real-time data transmission, they are often equipped with signal-boosting repeaters blocking the interrogator’s laser pulses and reducing the usable length to the first 50-70 km (Hartog et al., 2018) (which has the advantage of enabling higher sampling frequencies). Dedicated DAS cables are also being installed and used to improve SNR. An existing DAS system review is available in Hartog et al. (2018). Access to DAS interrogators through vendors (rent or purchase) is currently limited and negotiated by a few dedicated research groups. Making DAS instrumentation available through shared community instrument pools2 is at the center of ongoing conversation within geophysical communities (Lindsey and Martin, 2021). Innovative applications, such as the passive subsurface exploration from whale calls depicted in § 2.5, only add to multi-disciplinary collaboration opportunities fostered by DAS, contributing to a holistic approach to studying our Oceans.
Additionally, to reach its fullest potential, DAS demands big data handling methods and real-time processing along with efficient ways to scan through fast computed time-space-frequency representation of the data (the 120 km of FO cable sampled for this work generated 7 TB of data a day), process and detect potential signals of interest. Furthermore, a better understanding of the system’s response to various sound sources and the availability of sensitivity response and calibration is critical in reliably estimating detection ranges. The estimation of this parameter is crucial to animal density estimations and the missing link to create occupation and presence maps to communicate to local stakeholders for conservation actions (Marques et al., 2013). This additional step can fast-track DAS from an engineering-oriented system to a robust, scalable, real-time and data-driven wildlife management information supplier, contributing to filling up the worldwide monitoring gaps for conservation.
4 Methods
4.1 Acoustic Analysis
Benefiting from the near-real-time transmission of the data from Svalbard to Trondheim, Norway, the strain data was stored in 10 s long × 30000 channels matrices in Hierarchical Data Format (HDF5) format. For the acoustic analysis and labeling, DAS-recorded data was exported as a multichannel audio file (.wav) per day after each day, keeping a channel every 10 km of the fiber, starting from 20 km off-shore. The entirety of the 42 days of acquisition was visually (from spectrograms) and aurally examined by two independent and experimented analysts (H.J.K. & L.B.), using Raven Pro v1.6.1 (K. Lisa Yang Center for Conservation Bioacoustic, 2019). Any potential whale call was then annotated with a time-frequency-bounded box and given a label. This analysis was conducted in the same timeframe as the experiment.
4.2 Spatio-Temporal Representation Conditioning
The raw data matrices (amplitude versus time and distance) are pre-processed to improve the Signal to Noise Ratio (SNR) and contrast in the spatio-temporal representation. For Figure 3, a narrow [15-18] Hz butterworth band-pass filter is applied to the data and channels are stacked in pairs to reduce the background noise without altering the low frequency content. Absolute values are used in the t-x representation.
More processing is used for Figure 4, first the signal is band-pass filtered: in the frequency domain between [16.7–17.2] Hz out of the fjord (62.5-90 km) to enhance the strereotyped blue whale calls and butterworth band-pass-filtered between [30-43] Hz to enhance down-sweeps inside the fjord (35–62.5 km). Then, a 3 × 3 symmetrical 2D median filter (resolution of 12 m/4.65 ms) is applied. Absolute values are used in the t-x representation. The median value is successively subtracted from each time and space sample of the absolute amplitude (median subtracted from each row and column).
4.3 Spatio-Spectral Representation
For the spatio-spectral representation Figure 4B, a [5-110] Hz butterworth band-pass filter is applied. Then, the recordings are analyzed with a time window duration relevant to the minimum duration of whale calls. The frequency content is then evaluated on each channel by a fast Fourier transform, constructing the t-x matrix. The median value is subtracted from each row and column for noise reduction. It is possible to generate an image for each time window. For a representation integrated over a longer time period, we used for each point of the t-x grid the difference between its maximum and average value in time.
4.4 Localization, Tracking and Beamforming
DAS receivers at the positions R{x,r=0,z} and whale position is at S {x = xw, r = rw, z = zw} where x is the position along the FO cable, r the cross-line range from the FO cable, z the depth and the subscript w stands for the whale. A grid of potential whale positions along the FO cable xn and ranges rm is established for the optimization problem, assuming a fixed calling depth zw = 30 m (Lewis et al., 2018; Bouffaut et al., 2021). The source position is estimated by finding the theoretical TDOA that matches best the observed TDOA between all receivers an arbitrary chosen reference receiver position R0{x0,r=0,z0} such as
with c = 1500 m/s the constant sound speed, where |x - xn|2 represents the distance between each receiver position and the tested position along the FO cable and h0,m is hn,m but for the reference R0. The search grid used has a resolution of 50 m in x, within predefined 5 km bound around observed signal apexes ([85-90]km) and a 20 m resolution in ranges, from [0-4] km. Note, that the water depth is deeper than 300 m before 87 m and about 180 m at 90 km.
The t-x observation is sectioned in 5-s windows and band-pass filtered between [5-80] Hz. The 5-s-duration of the window allows for integrating the calculation over a period within the same order as the observed signals and covering potential time delays over the entire observed FO length. In the t-x representation of the TDOA, the apex gives information on xw while the opening of the hyperbola gives information on rw. The TDOA are estimated for each receiver position as the lags corresponding to the maximum of the cross-correlation between R0 and the other receivers. Unrealistic values, e.g., | TDOA | ≥ observed FO length over c are discarded along with | TDOA | ≤ 5 ms.
The optimization process is performed in 3 steps. First, the initialization cross-correlates measured and theoretical TDOA, where the maximum outcome initializes S {x =xw, r = rw, z = zw}. The process is run a second time after filtering out measurement points that diverge from the initialization fit of more than the standard deviation of the difference between the theoretical and measured data points. This second run gives the best xw. A third step is added to improve the rw estimation by minimizing the root mean square error between the theoretical and measured points in a 1 km window around xw.
To extend the single point localization to tracking, the localization procedure is applied iteratively to each 5-s window and only S {x =xw, r = rw, z = zw} points with a correlation coefficient higher than 0.85 are kept. The threshold is chosen to differentiate between signal and noise windows. A similar localization and tracking method was applied to signals received from a ship on the Svalbard DAS array and its positioning system (Automatic identification system; AIS) was used to ground-truth this localization method (Landrø et al., 2021).
Once S {x =xw, r = rw, z = zw} known, time delays can be compensated to beamform the received signal. In practice, only the 10 receivers with the most energy are summed-up, to limit the influence of coherent destructive interferences.
4.5 Seismic Profiles and Interferences Analysis
This method investigates the possibility of subsurface exploration from frequency-modulated whale vocalizations measured by the seabed DAS array in Svalbard. To that extent, we used 4 - 8 s long down-sweeps recorded by the array, sharing similarities with the seismic signals from vibroseis (Crawford et al., 1960), a commonly used source in land seismic exploration. Classically, shot profiles are obtained by cross-correlating the known source signal to the received signals. The following describes a method to estimate a whale call source signal from data recorded by DAS, which is then cross-correlated with the same received call over multiple channels to produce an interpretable seismic profile.
First, TDOA between channels are compensated as in § 4.4. These time-compensated signals contain coherent interferences introduced by multi-path propagation and reflection with a change of phase at an interface (e.g., at the surface), known as the Lloyd’s mirror effect (Carey, 2009) or ghost effect. Specifically, destructive interferences create notches in spectral representations of the signal, varying with the source depth, the wavenumber, and the grazing angle between the source and receivers (Carey, 2009). Additionally, the time-compensated signals are auto-correlated to estimate the time of arrival of the sea-surface-reflected wave. This information is further used to remove the contribution of the interferences by applying predictive (gapped) deconvolution to the time-compensated signals (Robinson and Treitel, 2008). The result of this process is stacked to produce the source signature. Finally, the DAS strain data associated with a whale call is cross-correlated with the corresponding source signature to obtain a seismic profile.
Following the method in Pereira et al. (2020); Bouffaut et al. (2021), a side analysis provides an estimate of the source depth from frequency notches associated with the interferences patterns, using a 100 s window on the time-compensated signals to include the waterborne direct arrival and the sea-surface reflection (Figure 6).
Data Availability Statement
The DAS-recorded spatio-temporal strain data supporting this analysis is available at https://doi.org/10.5281/zenodo.5823343 (Bouffaut and Taweesintananon, 2022).
Ethics Statement
Ethical review and approval was not required for the animal study because it was conducted by remote sensing using passive acoustics without any kind of contact, interactions or disturbances of the animals.
Author Contributions
LB wrote the manuscript, read and approved by all co-authors. LB and HK conducted the acoustic data analysis; LB designed and produced most of the results shown in the manuscript, interpreted together with HK, ML and JP. KT and ML produced and wrote about the subsurface exploration results and interpretation. LB, KT and RR developed data handling and processing routines. ML, JB, AH, SJ, OS, and FS conceived the experiment, AH and FS collected the DAS data. All authors contributed to the article and approved the submitted version.
Funding
LB and HK are funded by the Research Center for Arctic Petroleum Exploration (ARCEx) partners, and the Research Council of Norway (Grant No. 228107). KT and RR are funded by the Geophysics and Applied Mathematics in Exploration and Safe production Project (GAMES) at NTNU (Research Council of Norway; Grant No. 294404). ML, JP, and SJ receive research funding from the Centre for Geophysical Forecasting (CGF) at NTNU, sponsored by Grant No. 309960 (Research Council of Norway). The acquisition of the data was financed by ARCEx and GAMES.
Conflict of Interest
Author KT is employed by PTT Exploration and Production Public Company Limited. Author JB is and AH was employed by Alcatel Submarine Networks Norway AS. Authors OS and FS are employed by Uninett AS (merged into Sikt in Jan. 2022).
The remaining authors declare that the research was conducted in the absence of any commercial or financial relationships that could be construed as a potential conflict of interest.
Publisher’s Note
All claims expressed in this article are solely those of the authors and do not necessarily represent those of their affiliated organizations, or those of the publisher, the editors and the reviewers. Any product that may be evaluated in this article, or claim that may be made by its manufacturer, is not guaranteed or endorsed by the publisher.
Acknowledgments
Whale sighting provided by Svalbard Adventures and Henningsen Transport & Guiding.
Supplementary Material
The Supplementary Material for this article can be found online at: https://www.frontiersin.org/articles/10.3389/fmars.2022.901348/full#supplementary-material
Supplementary Audio 1 | Audio associated to the series of stereotyped North Atlantic blue whale calls and down-sweeps represented on Figure 2D at 76.6 km, sped up 3.5 times.
Supplementary Audio 2 | Audio associated to the series of non-stereotyped arched sounds and down-sweeps represented on Figure 2D 25.1 km, sped up 3.5 times.
Supplementary Audio 3 | Audio associated to the series of down-sweeps represented on Figure 2D at 49.0 km, sped up 3.5 times.
Supplementary Audio 4 | High-quality beamformed audio of the blue whale stereotyped and D-calls represented on Figures 5C, G, K, sped up 3.5 times.
Supplementary Video 1 | Animation showing the successive 2-s f-x plots used to construct the integrated representation of Figure 4B.
Footnotes
References
Ahonen H., Stafford K. M., de Steur L., Lydersen C., Wiig Ø., Kovacs K. M. (2017). The Underwater Soundscape in Western Fram Strait: Breeding Ground of Spitsbergen’s Endangered Bowhead Whales. Mar. Pollut. Bull. 123, 97–112. doi: 10.1016/j.marpolbul.2017.09.019
Ahonen H., Stafford K. M., Lydersen C., Berchok C. L., Moore S. E., Kovacs K. M. (2021). Interannual Variability in Acoustic Detection of Blue and Fin Whale Calls in the Northeast Atlantic High Arctic Between 2008 and 2018. Endang. Specie. Res. 45, 209–224. doi: 10.3354/esr01132
Asghar A. (2011). Processing and Interpretation of Multichannel Seismic Data From Isfjorden, Svalbard. Master’s Thesis (Bergen: The University of Bergen).
Bailey H., Mate B. R., Palacios D. M., Irvine L., Bograd S. J., Costa D. P. (2009). Behavioural Estimation of Blue Whale Movements in the Northeast Pacific From State-Space Model Analysis of Satellite Tracks. Endang. Specie. Res. 10, 93–106. doi: 10.3354/esr00239
Bannister J. L. (2018). “Baleen Whales (Mysticeti),” in Encyclopedia of Marine Mammals (Cambridge, Massachusetts: Elsevier), 62–69. doi: 10.1016/B978-0-12-804327-1.00058-3
Baumgartner M. F., Stafford K. M., Latha G. (2018). “Near Real-Time Underwater Passive Acoustic Monitoring of Natural and Anthropogenic Sounds,” in In Observing the Oceans in Real Time. Eds. Venkatesan R., Tandon A., D’Asaro E., Atmanand M. A. (Cham: Springer International Publishing), 203–226. doi: 10.1007/978-3-319-66493-4_10
Blinova M., Faleide J. I., Gabrielsen R. H., Mjelde R. (2012). Seafloor Expression and Shallow Structure of a Fold-and-Thrust System, Isfjorden, West Spitsbergen. Polar. Res. 31, 11209. doi: 10.3402/polar.v31i0.11209
Blinova M., Thorsen R., Mjelde R., Faleide J. I. (2009). Structure and Evolution of the Bellsund Graben Between Forlandsundet and Bellsund (Spitsbergen) Based on Marine Seismic Data. Norweg. J. Geol. 89, 215–228.
Bouffaut L., Landrø M., Potter J. R. (2021). Source Level and Vocalizing Depth Estimation of Two Blue Whale Subspecies in the Western Indian Ocean From Single Sensor Observations. J. Acoust. Soc. America 149, 4422–4436. doi: 10.1121/10.0005281
Bouffaut L., Taweesintananon K. (2022). Das4whale: Svalbard Distributed Acoustic Sensing Dataset for Baleen Whale Monitoring. Dataset. doi: 10.5281/zenodo.5823343
Carey W. M. (2009). Lloyd’s Mirror-Image Interference Effects. Acoust. Today 5, 14–20. doi: 10.1121/1.3182842
Crawford J. M., Doty W. E. N., Lee M. R. (1960). Continuous Signal Seismograph. Geophysics 25, 95–105. doi: 10.1190/1.1438707
Croll D. A., Acevedo-Gutiérrez A., Tershy B. R., Urbán-Ramírez J. (2001). The Diving Behavior of Blue and Fin Whales: Is Dive Duration Shorter Than Expected Based on Oxygen Stores? Comp. Biochem. Physiol. Part A.: Mol. Integr. Physiol. 129, 797–809. doi: 10.1016/S1095-6433(01)00348-8
Culshaw B., Kersey A. (2008). Fiber-Optic Sensing: A Historical Perspective. J. Lightw. Technol. 26, 1064–1078. doi: 10.1109/JLT.0082.921915
Daley T. M., Freifeld B. M., Ajo-Franklin J., Dou S., Pevzner R., Shulakova V., et al. (2013). Field Testing of Fiber-Optic Distributed Acoustic Sensing (DAS) for Subsurface Seismic Monitoring. Lead. Edge. 32, 699–706. doi: 10.1190/tle32060699.1
Dean T., Cuny T., Hartog A. H. (2017). The Effect of Gauge Length on Axially Incident P-Waves Measured Using Fibre Optic Distributed Vibration Sensing. Geophys. Prospect. 65, 184–193. doi: 10.1111/1365-2478.12419
Eguíluz V. M., Fernández-Gracia J., Irigoien X., Duarte C. M. (2016). A Quantitative Assessment of Arctic Shipping in 2010–2014. Sci. Rep. 6, 1–6. doi: 10.1038/srep30682
Goertz A., Wuestefeld A. (2018). Real-Time Passive Monitoring With a Fibre-Optic Ocean Bottom Array. First. Break. 36, 55–61. doi: 10.3997/1365-2397.n0083
Hamilton C. D., Lydersen C., Aars J., Biuw M., Boltunov A. N., Born E. W., et al. (2021). Marine Mammal Hotspots in the Greenland and Barents Seas. Mar. Ecol. Prog. Ser. 659, 3–28. doi: 10.3354/meps13584
Hartog A. H., Belal M., Clare M. A. (2018). Advances in Distributed Fiber-Optic Sensing for Monitoring Marine Infrastructure, Measuring the Deep Ocean, and Quantifying the Risks Posed by Seafloor Hazards. Mar. Technol. Soc. J. 52, 58–73. doi: 10.4031/MTSJ.52.5.7
Howe B. M., Miksis-Olds J., Rehm E., Sagen H., Worcester P. F., Haralabus G. (2019). Observing the Oceans Acoustically. Front. Mar. Sci. 6. doi: 10.3389/fmars.2019.00426
Hucke-Gaete R., Bedriñana-Romano L., Viddi F. A., Ruiz J. E., Torres-Florez J. P., Zerbini A. N. (2018). From Chilean Patagonia to Galapagos, Ecuador: Novel Insights on Blue Whale Migratory Pathways Along the Eastern South Pacific. PeerJ 6, e4695. doi: 10.7717/peerj.4695
IUCN (2021). (Version 2021-2). The IUCN Red List of Threatened Species. www.iucnredlist.org
Jensen F. B., Kuperman W. A., Porter M. B., Schmidt H. (2011). Computational Ocean Acoustics (New York, NY: Springer Science & Business Media). doi: 10.1007/978-1-4417-8678-8
Klinck H., Nieukirk S. L., Mellinger D. K., Klinck K., Matsumoto H., Dziak R. P. (2012). Seasonal Presence of Cetaceans and Ambient Noise Levels in Polar Waters of the North Atlantic. J. Acoust. Soc. America 132, EL176–EL181. doi: 10.1121/1.4740226
K. Lisa Yang Center for Conservation Bioacoustics (2019). Raven Pro: Interactive Sound Analysis Software (Version 1.6.1) Dataset. (Ithaca, New York: Cornell University)
Kowarski K. A., Moors-Murphy H. (2021). A Review of Big Data Analysis Methods for Baleen Whale Passive Acoustic Monitoring. Mar. Mamm. Sci. 37, 652–673. doi: 10.1111/mms.12758
Kuna V. M., Nábělek J. L. (2021). Seismic Crustal Imaging Using Fin Whale Songs. Science 371, 731–735. doi: 10.1126/science.abf3962
Landrø M., Bouffaut L., Kriesell H. J., Potter J. R., Rørstadbotnen R. A., Taweesintananon K., et al. (2021). Title: Sensing Whales, Storms, Ships and Earthquakes Using an Arctic Fibre- Optic Cable. Earth Space. Sci. Open Arch. 39, 1–39. doi: 10.1002/essoar.10507855.1
Lewis L. A., Calambokidis J., Stimpert A. K., Fahlbusch J., Friedlaender A. S., McKenna M. F., et al. (2018). Context-Dependent Variability in Blue Whale Acoustic Behaviour. R. Soc. Open Sci. 5, 180241. doi: 10.1098/rsos.180241
Lindsey N. J., Dawe T. C., Ajo-Franklin J. B. (2019). Illuminating Seafloor Faults and Ocean Dynamics With Dark Fiber Distributed Acoustic Sensing. Science 366, 1103–1107. doi: 10.1126/science.aay5881
Lindsey N. J., Martin E. R. (2021). Fiber-Optic Seismology. Annu. Rev. Earth Planet. Sci. 49, 309–336. doi: 10.1146/annurev-earth-072420-065213
Lydersen C., Vacquié-Garcia J., Heide-Jørgensen M. P., Øien N., Guinet C., Kovacs K. M. (2020). Autumn Movements of Fin Whales (Balaenoptera Physalus) From Svalbard, Norway, Revealed by Satellite Tracking. Sci. Rep. 10, 1–13. doi: 10.1038/s41598-020-73996-z
Marques T. A., Thomas L., Martin S. W., Mellinger D. K., Ward J. A., Moretti D. J., et al. (2013). Estimating Animal Population Density Using Passive Acoustics. Biol. Rev. 88, 287–309. doi: 10.1111/brv.12001
Matsumoto H., Araki E., Kimura T., Fujie G., Shiraishi K., Tonegawa T., et al. (2021). Detection of Hydroacoustic Signals on a Fiber-Optic Submarine Cable. Sci. Rep. 11, 2797. doi: 10.1038/s41598-021-82093-8
McDonald M. A., Mesnick S. L., Hildebrand J. A. (2006). Biogeographic Characterization of Blue Whale Song Worldwide: Using Song to Identify Populations. J. Cetac. Res. Manage. 8, 55–65.
Mellinger D. K., Clark C. W. (2003). Blue Whale (Balaenoptera Musculus) Sounds From the North Atlantic. J. Acoust. Soc Am. 114, 1108–1119. doi: 10.1121/1.1593066
Mellinger D. K., Stafford K. M., Moore S. E., Dziak R. P., Matsumoto H. (2007). An Overview of Fixed Passive Acoustic Observation Methods for Cetaceans. Oceanography 20, 36–45. doi: 10.5670/oceanog.2007.03
Moore S. E., Haug T., Víkingsson G. A., Stenson G. B. (2019). Baleen Whale Ecology in Arctic and Subarctic Seas in an Era of Rapid Habitat Alteration. Prog. Oceanogr. 176, 102118. doi: 10.1016/j.pocean.2019.05.010
Ng A. K., Andrews J., Babb D., Lin Y., Becker A. (2018). Implications of Climate Change for Shipping: Opening the Arctic Seas. Wiley. Interdiscip. Review.: Climate Change 9, e507. doi: 10.1002/wcc.507
Nieukirk S. L., Mellinger D. K., Dziak R. P., Matsumoto H., Klinck H. (2020). Multi-Year Occurrence of Sei Whale Calls in North Atlantic Polar Waters. J. Acoust. Soc. America 147, 1842–1850. doi: 10.1121/10.0000931
Nishiguchi K. (2016). “Phase Unwrapping for Fiber-Optic Distributed Acoustic Sensing,” in Proceedings of the ISCIE International Symposium on Stochastic Systems Theory and Its Applications (Fukuoka, Japan: The ISCIE Symposium on Stochastic Systems Theory and Its Applications), Vol. 2016. 81–87.
Oleson E. M., Calambokidis J., Burgess W. C., McDonald M. A., LeDuc C. A., Hildebrand J. A. (2007). Behavioral Context of Call Production by Eastern North Pacific Blue Whales. Mar. Ecol. Prog. Ser. 330, 269–284. doi: 10.3354/meps330269
Ou H., Au W. W., Van Parijs S., Oleson E. M., Rankin S. (2015). Discrimination of Frequency-Modulated Baleen Whale Downsweep Calls With Overlapping Frequencies. J. Acoust. Soc. America 137, 3024–3032. doi: 10.1121/1.4919304
Parker T., Shatalin S., Farhadiroushan M. (2014). Distributed Acoustic Sensing–A New Tool for Seismic Applications. First. Break. 32, 61–69. doi: 10.3997/1365-2397.2013034
Pereira A., Harris D., Tyack P., Matias L. (2020). On the Use of the Lloyd’s Mirror Effect to Infer the Depth of Vocalizing Fin Whales. J. Acoust. Soc Am. 148, 3086–3101. doi: 10.1121/10.0002426
Recalde-Salas A., Erbe C., Salgado Kent C., Parsons M. (2020). Non-Song Vocalizations of Humpback Whales in Western Australia. Front. Mar. Sci. 7, 141. doi: 10.3389/fmars.2020.00141
Reeves R. R., Ewins P. J., Agbayani S., Heide-Jørgensen M. P., Kovacs K. M., Lydersen C., et al. (2014). Distribution of Endemic Cetaceans in Relation to Hydrocarbon Development and Commercial Shipping in a Warming Arctic. Mar. Policy 44, 375–389. doi: 10.1016/j.marpol.2013.10.005
Rivet D., de Cacqueray B., Sladen A., Roques A., Calbris G. (2021). Preliminary Assessment of Ship Detection and Trajectory Evaluation Using Distributed Acoustic Sensing on an Optical Fiber Telecom Cable. J. Acoust. Soc. America 149, 2615–2627. doi: 10.1121/10.0004129
Robinson E. A., Treitel S. (2008). Digital Imaging and Deconvolution: The ABCs of Seismic Exploration and Processing (Society of Exploration Geophysicists). (Tulsa, Oklahoma: Society of Exploration Geophysicists)
Romagosa M., Pérez-Jorge S., Cascão I., Mouriño H., Lehodey P., Pereira A., et al. (2021). Food Talk: 40-Hz Fin Whale Calls are Associated With Prey Biomass. Proc. R. Soc. B. 288, 20211156. doi: 10.1098/rspb.2021.1156
Schaaf N. W. (2018). Tectono-Sedimentary History of the Forlandsundet Graben. Master’s Thesis (Oslo: University of Oslo).
Schenato L. (2017). A Review of Distributed Fibre Optic Sensors for Geo-Hydrological Applications. Appl. Sci. 7, 896. doi: 10.3390/app7090896
Širović A., McDonald M., Balcazar-Cabrera N., Buchan S., Cerchio S., Clark C., et al. (2017). “Blue Whale Songs Worldwide: An Update,” in 22nd Biennial Conference of the Biology of Marine Mammals (Society for Marine Mammalogy). (Halifax, Canada: 22nd Biennial Conference on the Biology of Marine Mammals)
Širović A., Williams L. N., Kerosky S. M., Wiggins S. M., Hildebrand J. A. (2013). Temporal Separation of Two Fin Whale Call Types Across the Eastern North Pacific. Mar. Biol. 160, 47–57. doi: 10.1007/s00227-012-2061-z
Sladen A., Rivet D., Ampuero J.-P., De Barros L., Hello Y., Calbris G., et al. (2019). Distributed Sensing of Earthquakes and Ocean-Solid Earth Interactions on Seafloor Telecom Cables. Nat. Commun. 10, 1–8. doi: 10.1038/s41467-019-13793-z
Storrie L., Lydersen C., Andersen M., Wynn R. B., Kovacs K. M. (2018). Determining the Species Assemblage and Habitat Use of Cetaceans in the Svalbard Archipelago, Based on Observations From 2002 to 2014. Polar. Res. 37, 1463065. doi: 10.1080/17518369.2018.1463065
Taweesintananon K., Landrø M., Brenne J. K., Haukanes A. (2021). Distributed Acoustic Sensing for Near-Surface Imaging Using Submarine Telecommunication Cable: A Case Study in the Trondheimsfjord, Norway. Geophysics 86, B303–B320. doi: 10.1190/geo2020-0834.1
Thomas P. O., Reeves R. R., Brownell J. R.L. (2016). Status of the World’s Baleen Whales. Mar. Mamm. Sci. 32, 682–734. doi: 10.1111/mms.12281
Tremblay C. J., Van Parijs S. M., Cholewiak D. (2019). 50 to 30-Hz Triplet and Singlet Down Sweep Vocalizations Produced by Sei Whales (Balaenoptera Borealis) in the Western North Atlantic Ocean. J. Acoust. Soc. America 145, 3351–3358. doi: 10.1121/1.5110713
van Weelden C., Towers J. R., Bosker T. (2021). Impacts of Climate Change on Cetaceans Distribution, Habitat and Migration. Climate Change Ecol. 1, 100009. doi: 10.1016/j.ecochg.2021.100009
Waagaard O. H., Rønnekleiv E., Haukanes A., Stabo-Eeg F., Thingbø D., Forbord S., et al. (2021). Real-Time Low Noise Distributed Acoustic Sensing in 171 Km Low Loss Fiber. OSA. Continuum. 4, 688–701. doi: 10.1364/OSAC.408761
Watkins W. A., Tyack P., Moore K. E., Bird J. E. (1987). The 20-Hz Signals of Finback Whales (Balaenoptera Physalus). J. Acoust. Soc Am. 82, 1901–1912. doi: 10.1121/1.395685
Keywords: distributed acoustic sensing, bioacoustics, passive acoustic monitoring, baleen whales, cetacean conservation, blue whale, fin whale
Citation: Bouffaut L, Taweesintananon K, Kriesell HJ, Rørstadbotnen RA, Potter JR, Landrø M, Johansen SE, Brenne JK, Haukanes A, Schjelderup O and Storvik F (2022) Eavesdropping at the Speed of Light: Distributed Acoustic Sensing of Baleen Whales in the Arctic. Front. Mar. Sci. 9:901348. doi: 10.3389/fmars.2022.901348
Received: 21 March 2022; Accepted: 20 May 2022;
Published: 05 July 2022.
Edited by:
Won Sang Lee, Korea Polar Research Institute, South KoreaReviewed by:
Hiroyuki Matsumoto, Japan Agency for Marine-Earth Science and Technology (JAMSTEC), JapanBrian S. Miller, Australian Antarctic Division, Australia
Copyright © 2022 Bouffaut, Taweesintananon, Kriesell, Rørstadbotnen, Potter, Landrø, Johansen, Brenne, Haukanes, Schjelderup and Storvik. This is an open-access article distributed under the terms of the Creative Commons Attribution License (CC BY). The use, distribution or reproduction in other forums is permitted, provided the original author(s) and the copyright owner(s) are credited and that the original publication in this journal is cited, in accordance with accepted academic practice. No use, distribution or reproduction is permitted which does not comply with these terms.
*Correspondence: Léa Bouffaut, lea.bouffaut@cornell.edu